Merge USAXS/SAXS/WAXS data
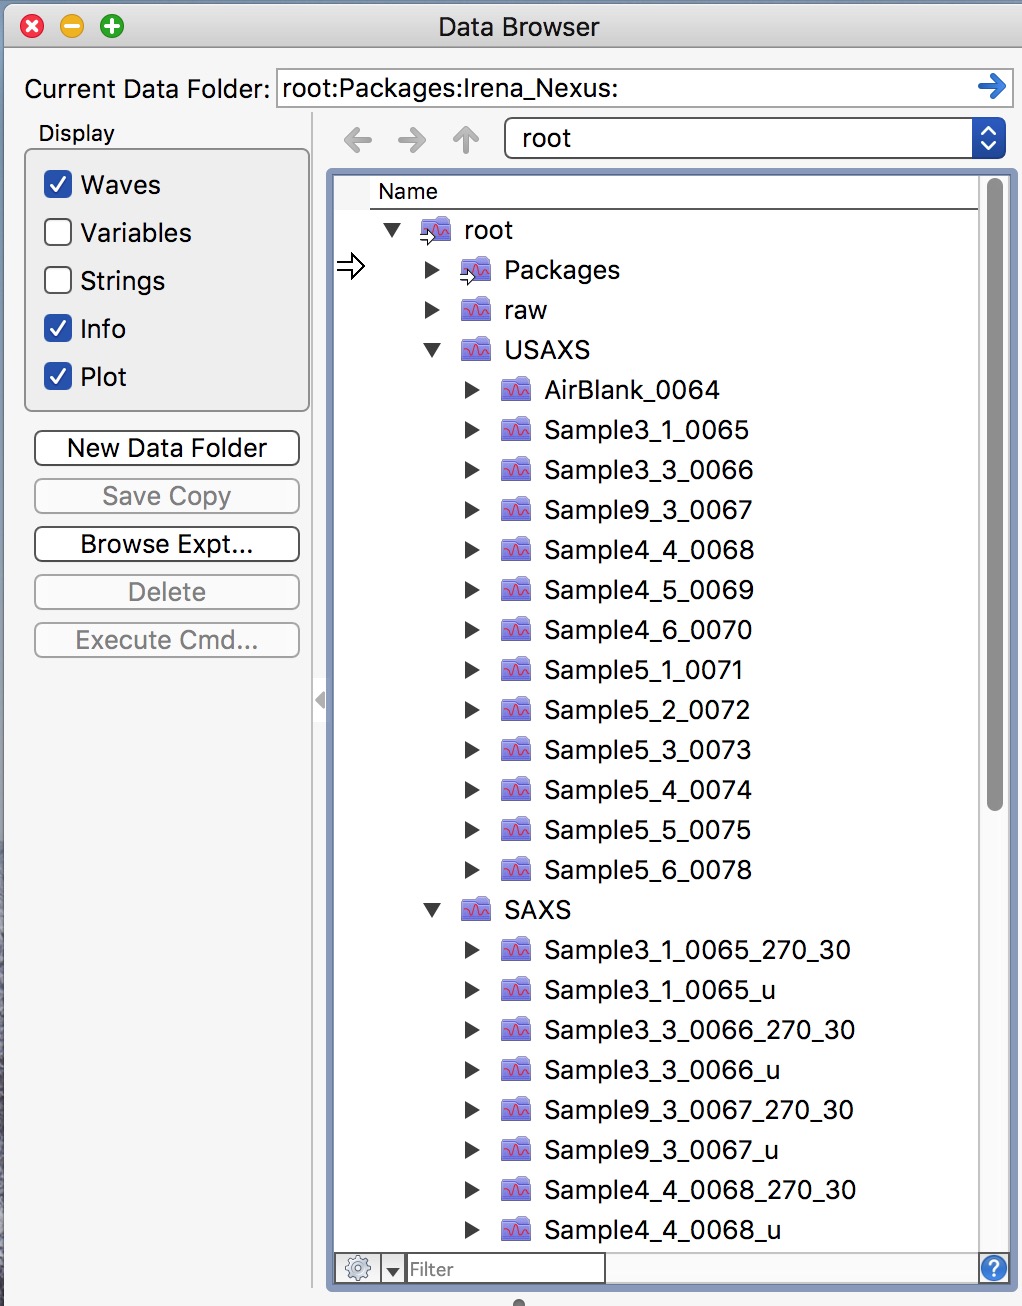
After reducing USAXS/SAXS/WAXS data, the results are stored in Igor folders
organized by sample name: USAXS data in root:USAXS:Samplename and SAXS
data in root:SAXS:Samplename_u (or Samplename_270_30). To browse the
current Igor experiment, use the Data Browser (Ctrl-B or Cmd-B).
To combine USAXS and SAXS data into a single merged dataset, use the Irena tool Merge two datasets.
Data Merging panel
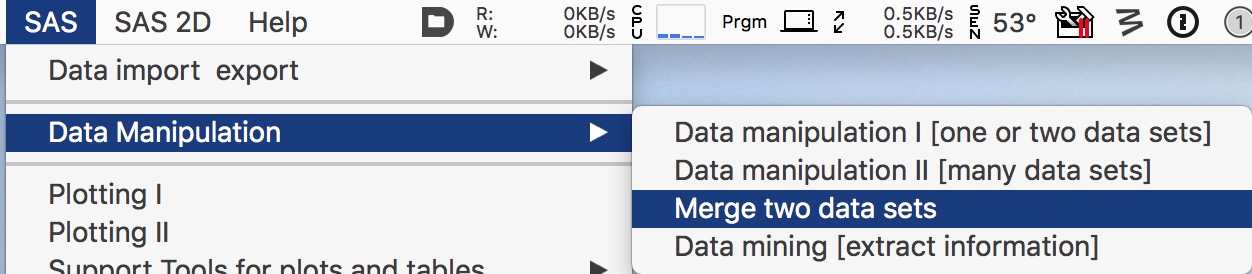
If needed, load Irena by selecting “Load Irena SAS macros” from the Macros menu. Then select “Data Manipulation” from the SAS menu, followed by “Merge two data sets”.
This opens a large panel:
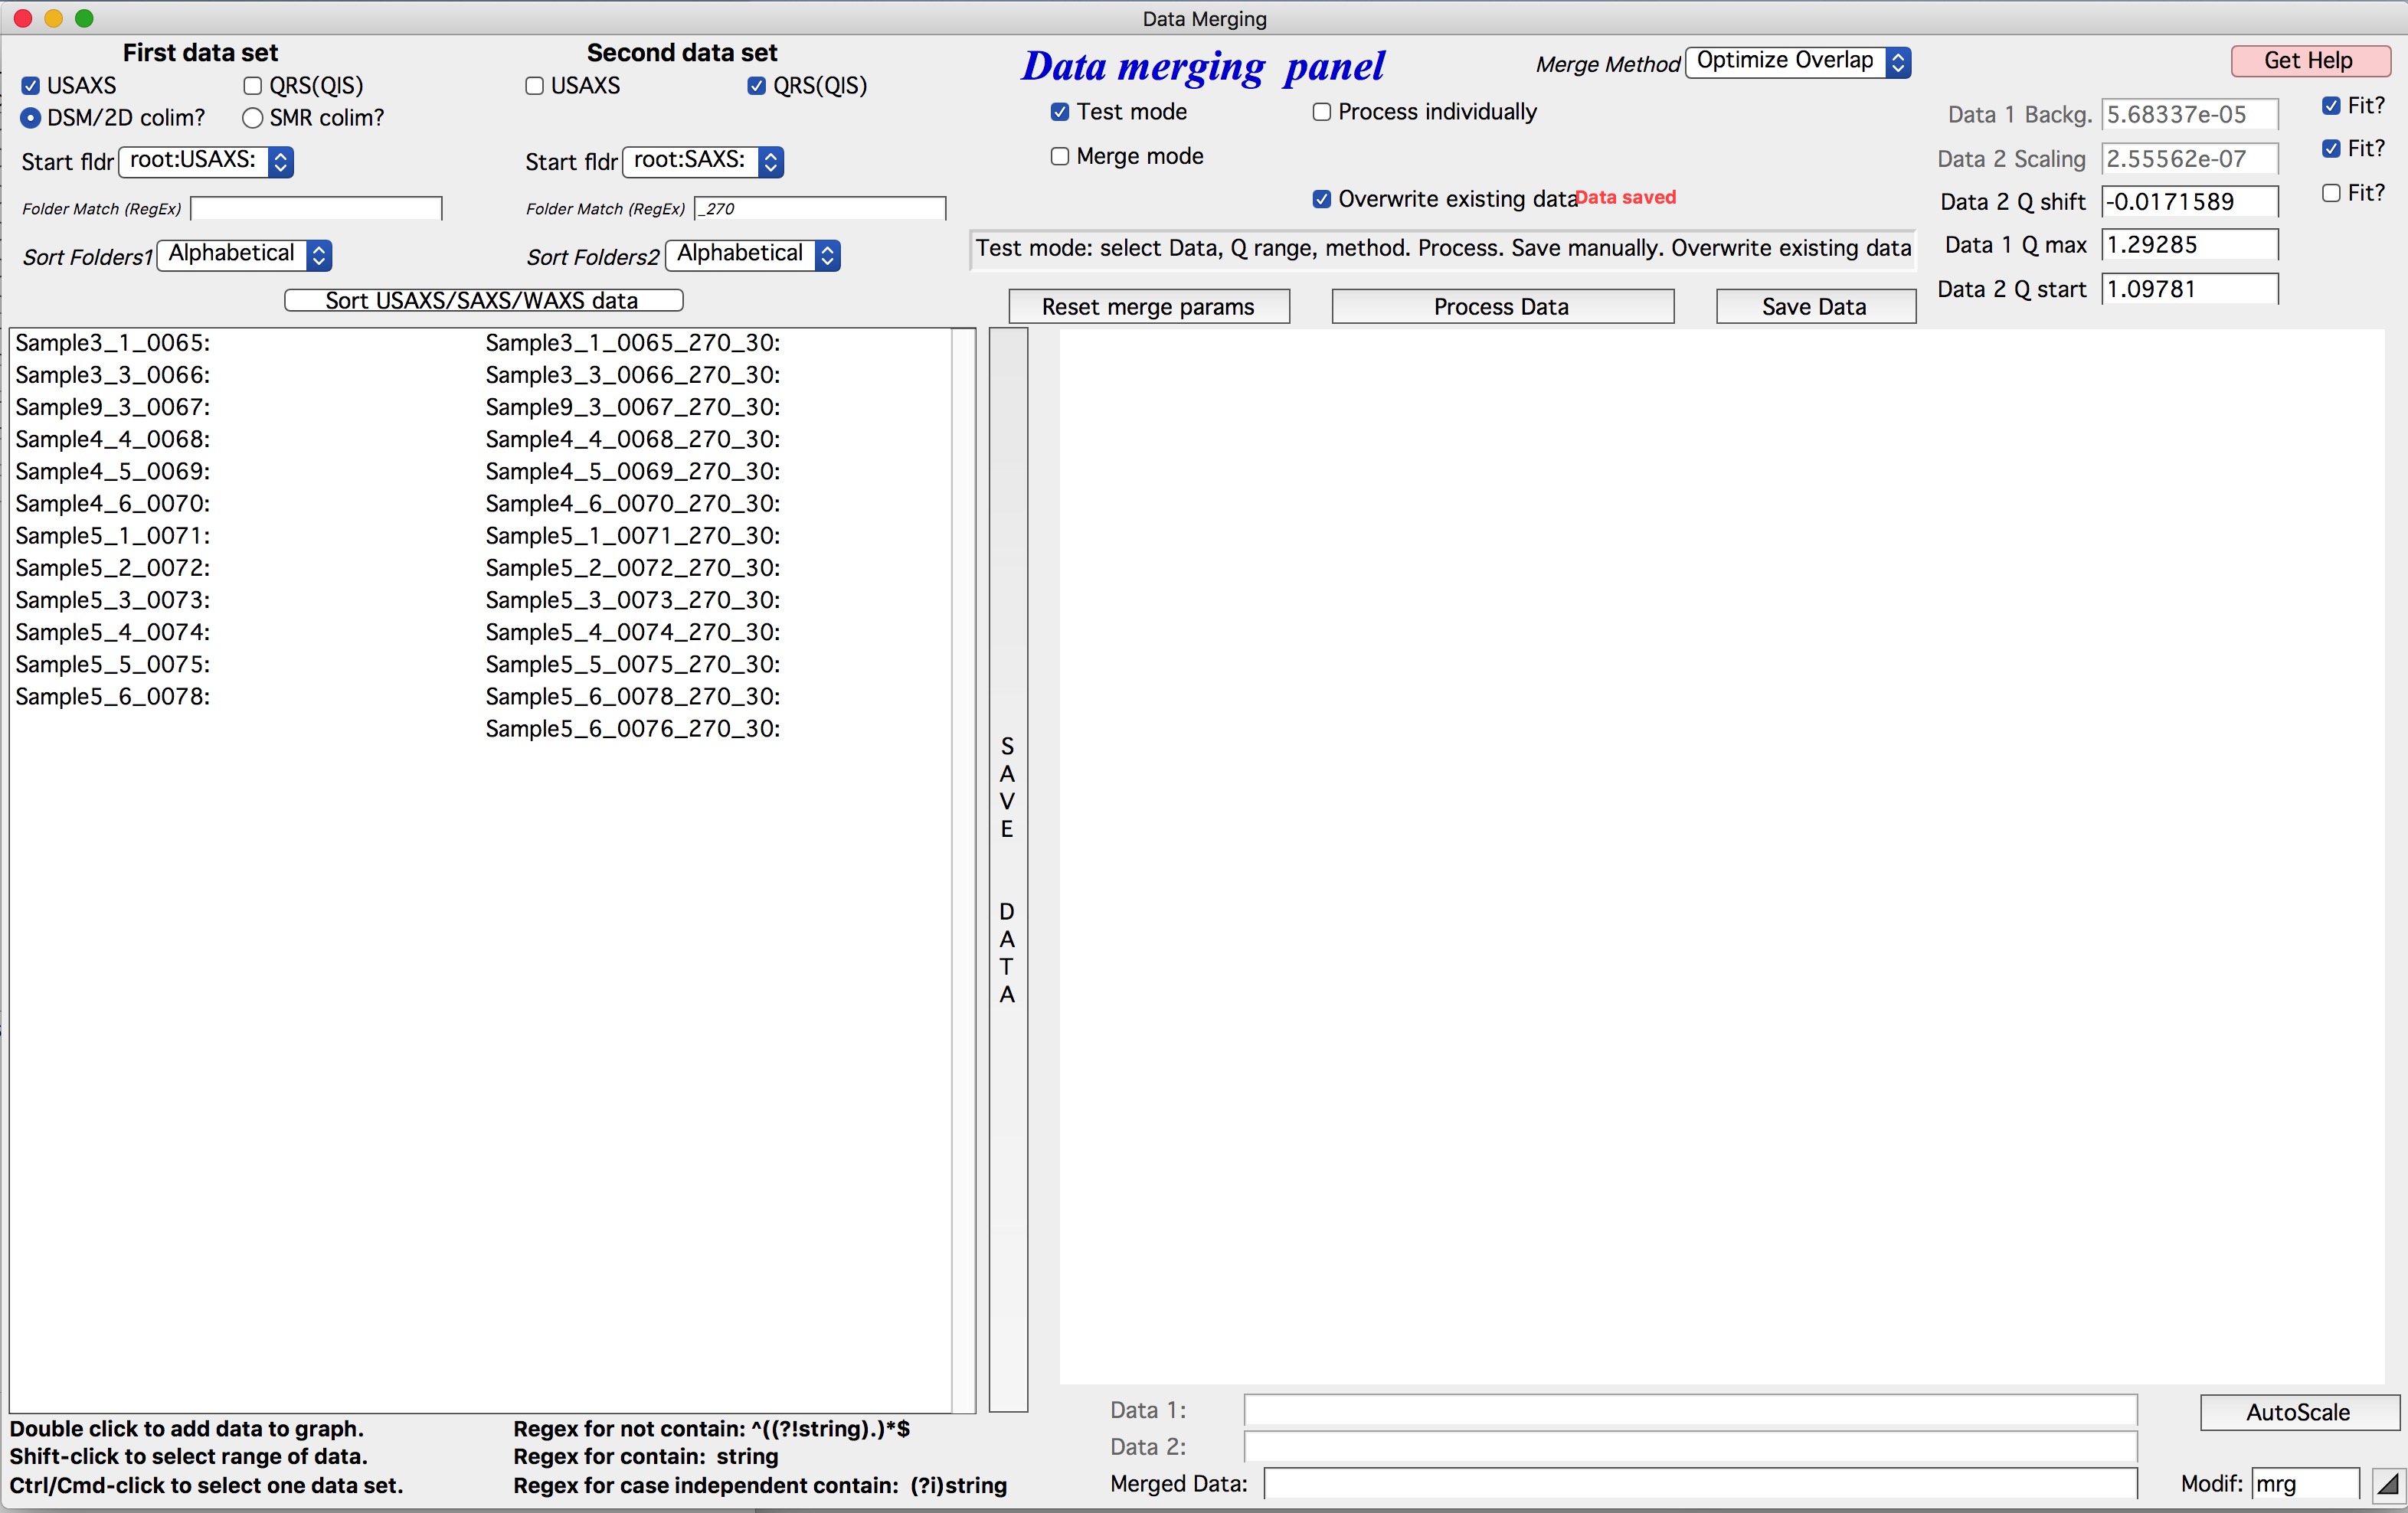
To merge desmeared USAXS data with SAXS data, configure as shown above: select
the USAXS checkbox and the DSM checkbox, and set the pull-down menu to
root:USAXS. For the second dataset, select the QRS checkbox and set the
pull-down menu to root:SAXS. When DSM data are selected for Dataset 1,
the code automatically inserts _270 in the Dataset 2 match field.
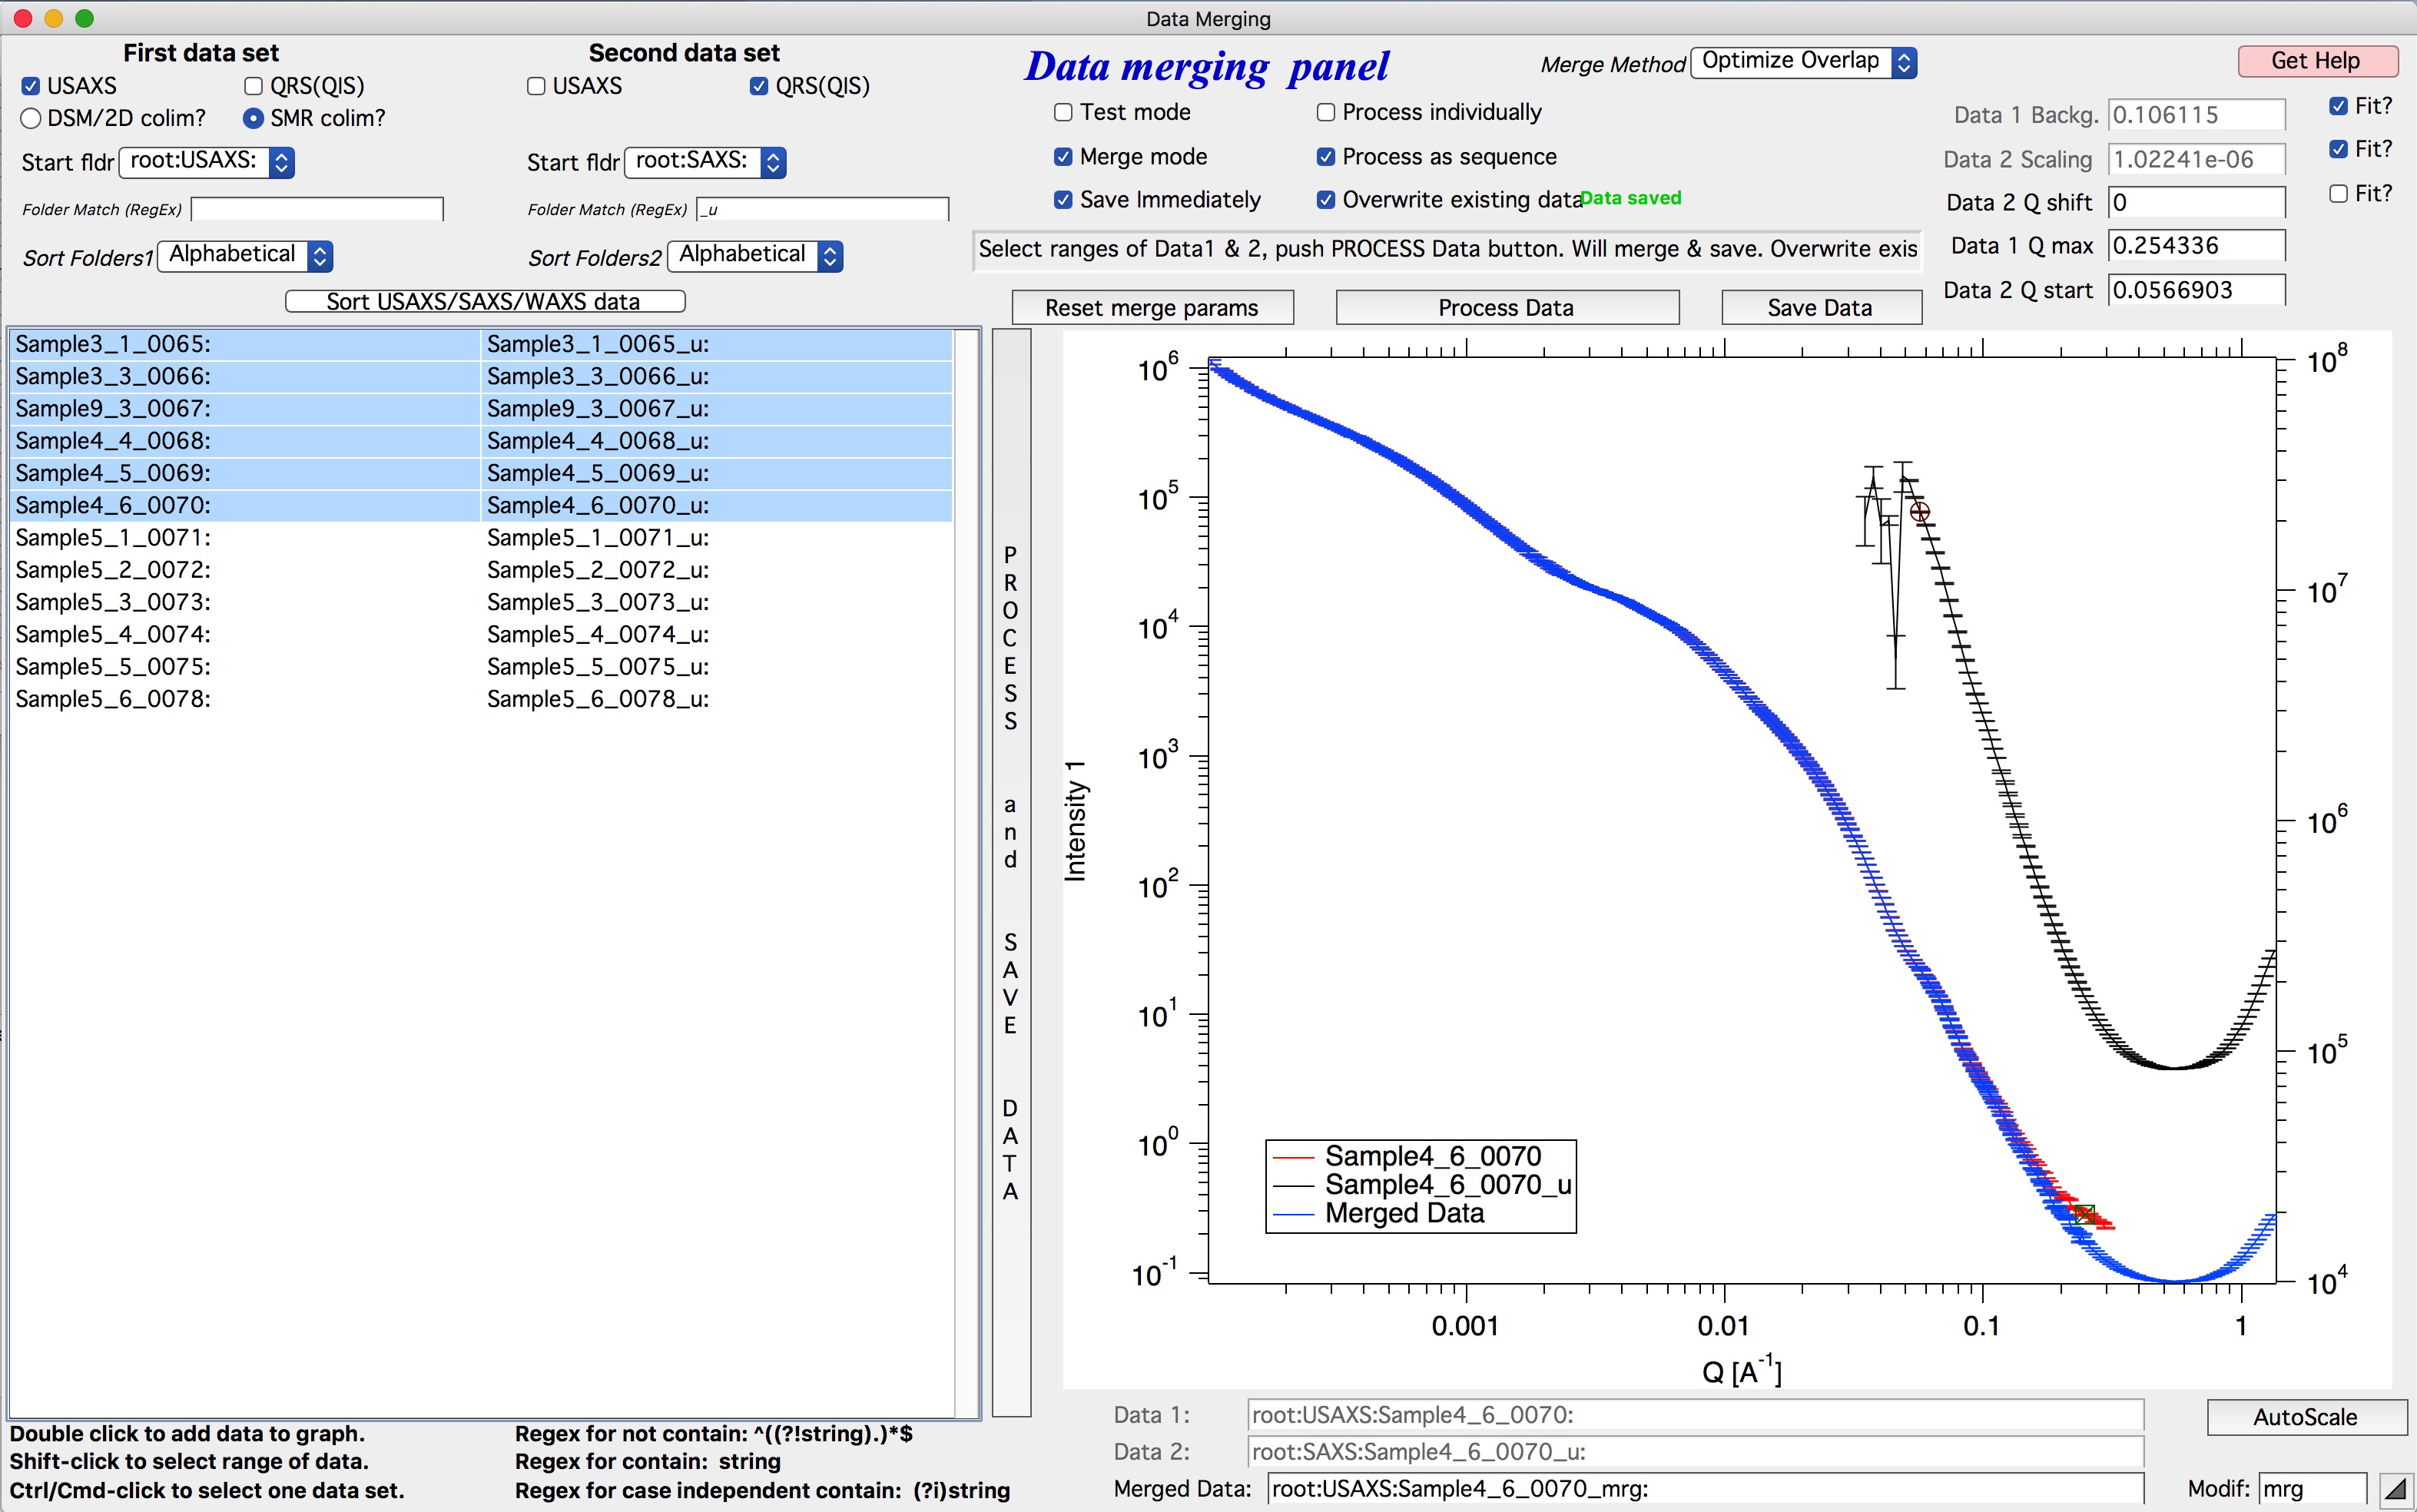
To merge slit-smeared data instead, configure as follows:
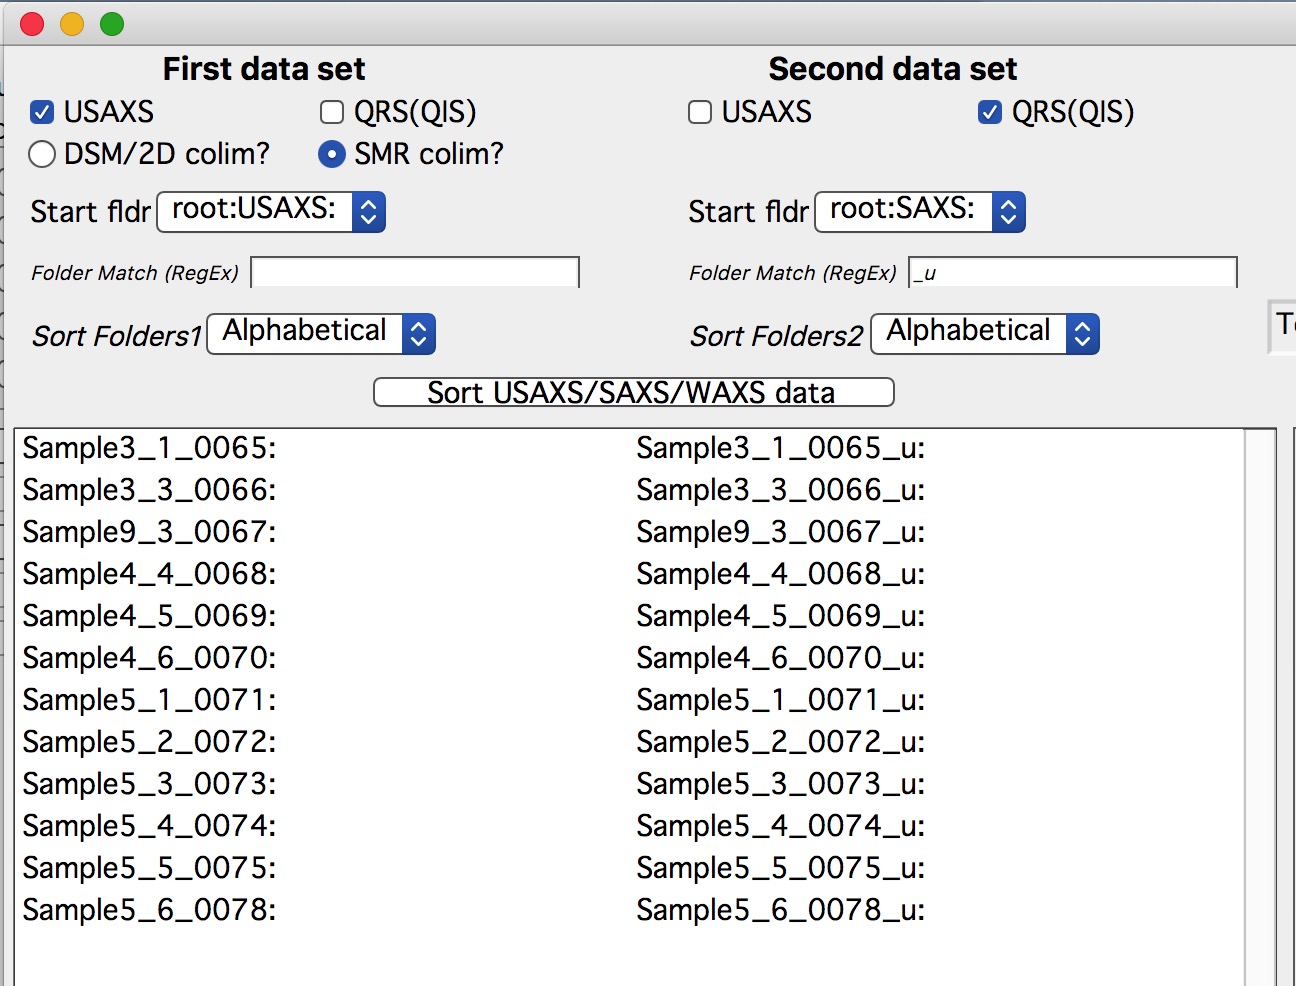
When the “SMR colim?” checkbox is selected for slit-smeared data, the code
automatically inserts _u in the Dataset 2 match field.
Testing merge settings
Ensure “Test mode” is enabled at the top of the right graph before adjusting merge parameters.
Double-click a dataset in the left column to add it to the graph in red. Double-click the corresponding SAXS dataset in the right column to add it in black, plotted against the right axis.
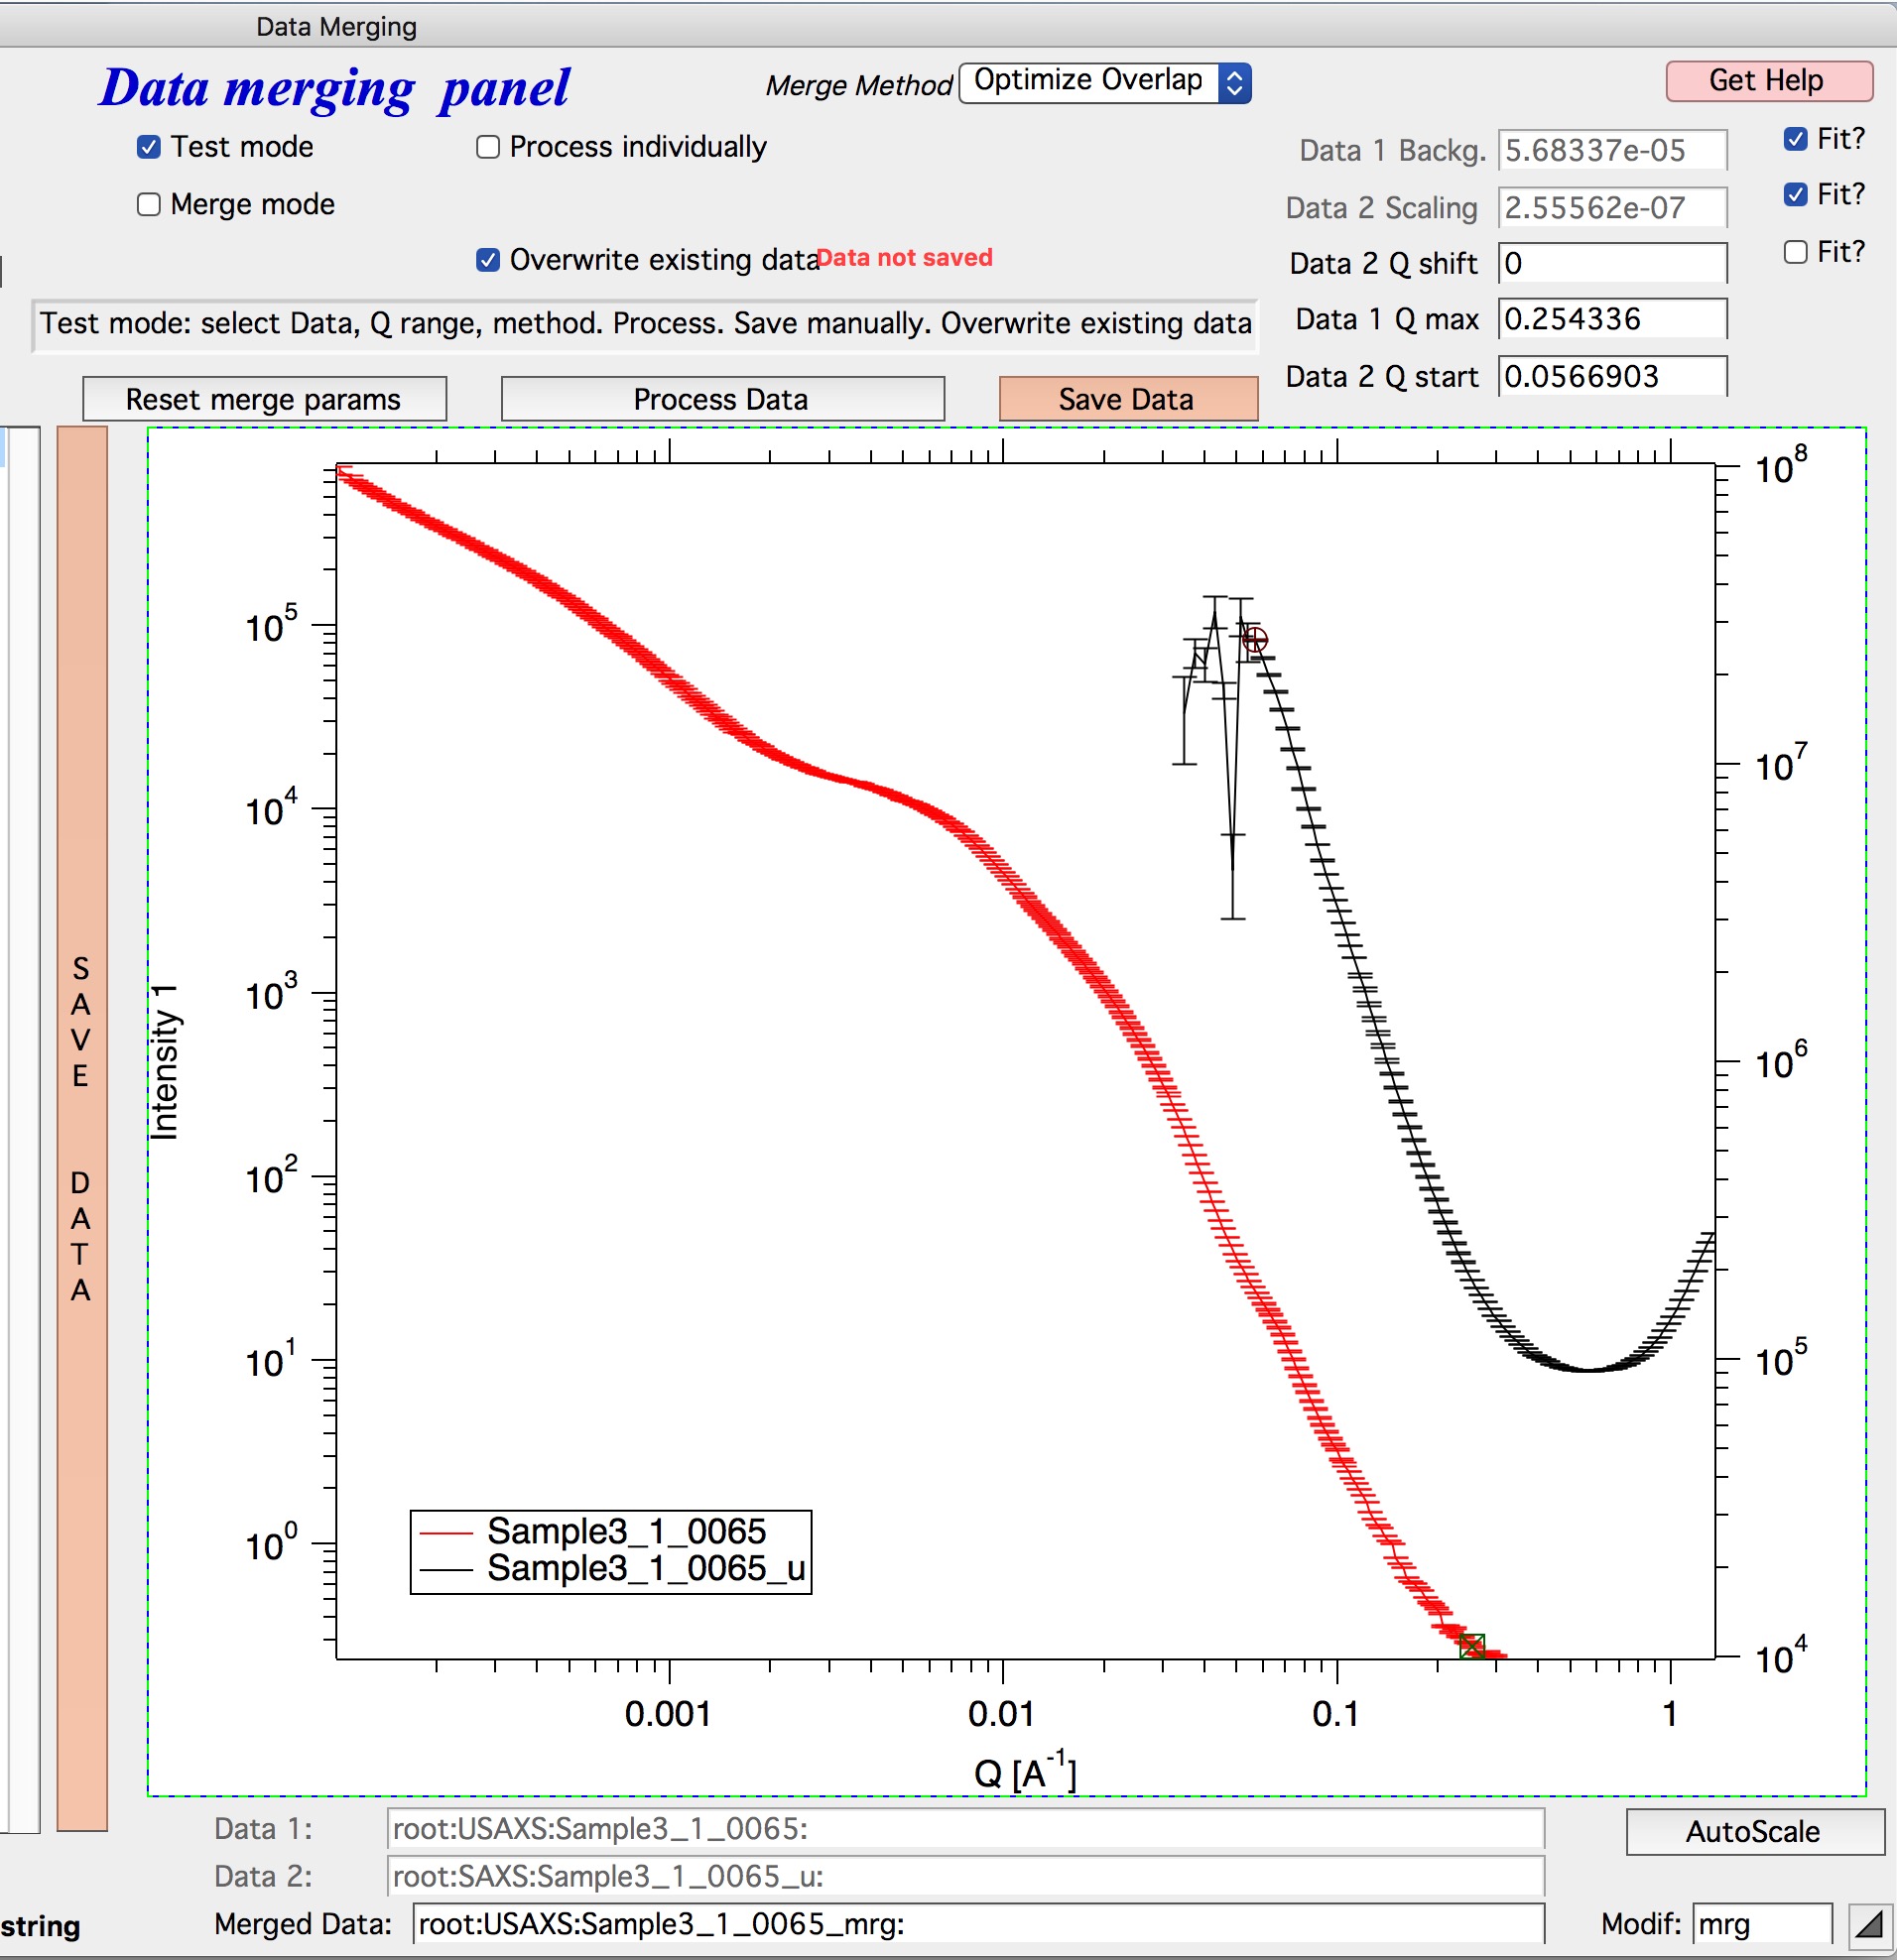
Select the merge method using the “Merge method” control at the top of the window. “Optimize Overlap” is the recommended method when both USAXS and SAXS data have sufficient scatter in the overlap region. For other situations, see Merge two datasets for descriptions of advanced methods or consult beamline staff.
Use the round cursor (on the black dataset) and the square cursor (on the red dataset) to define the overlap region. Data at Q values below the round cursor are truncated from the black dataset; data above the square cursor are truncated from the red dataset. Sufficient overlap between the two datasets is required.
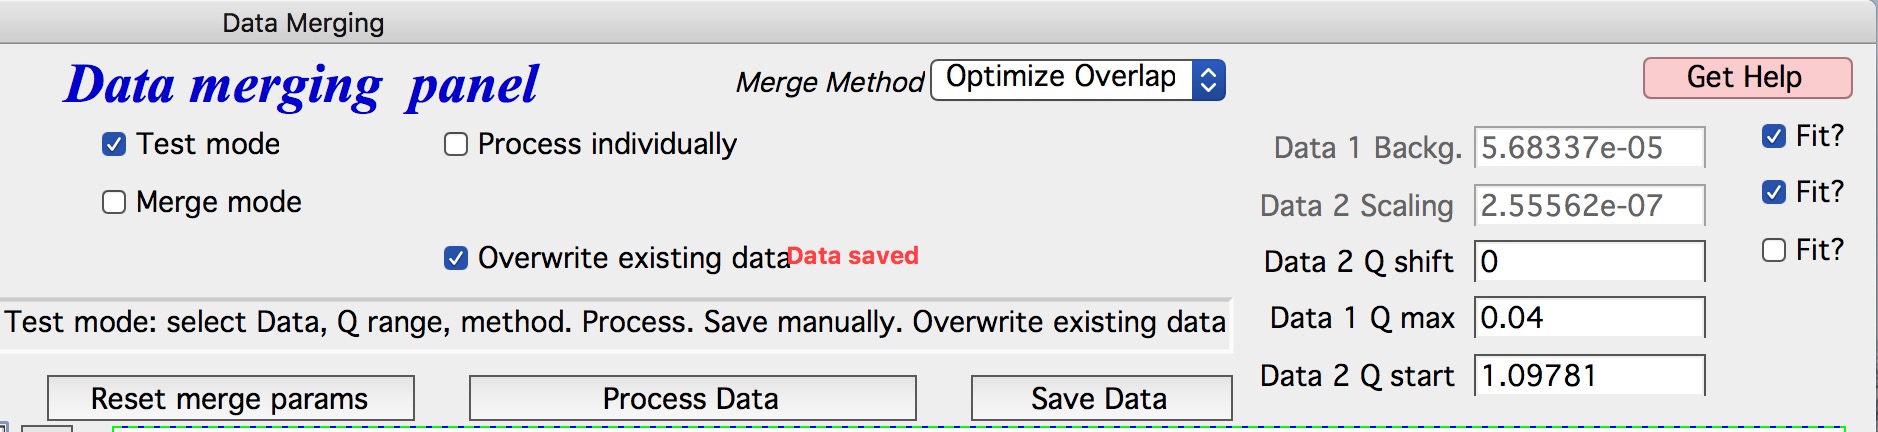
Select the parameters to optimize: typically “Data 1 background” and “Data 2 scaling” (top-left checkboxes) are always needed. “Data 2 Q shift” may be needed in some cases.
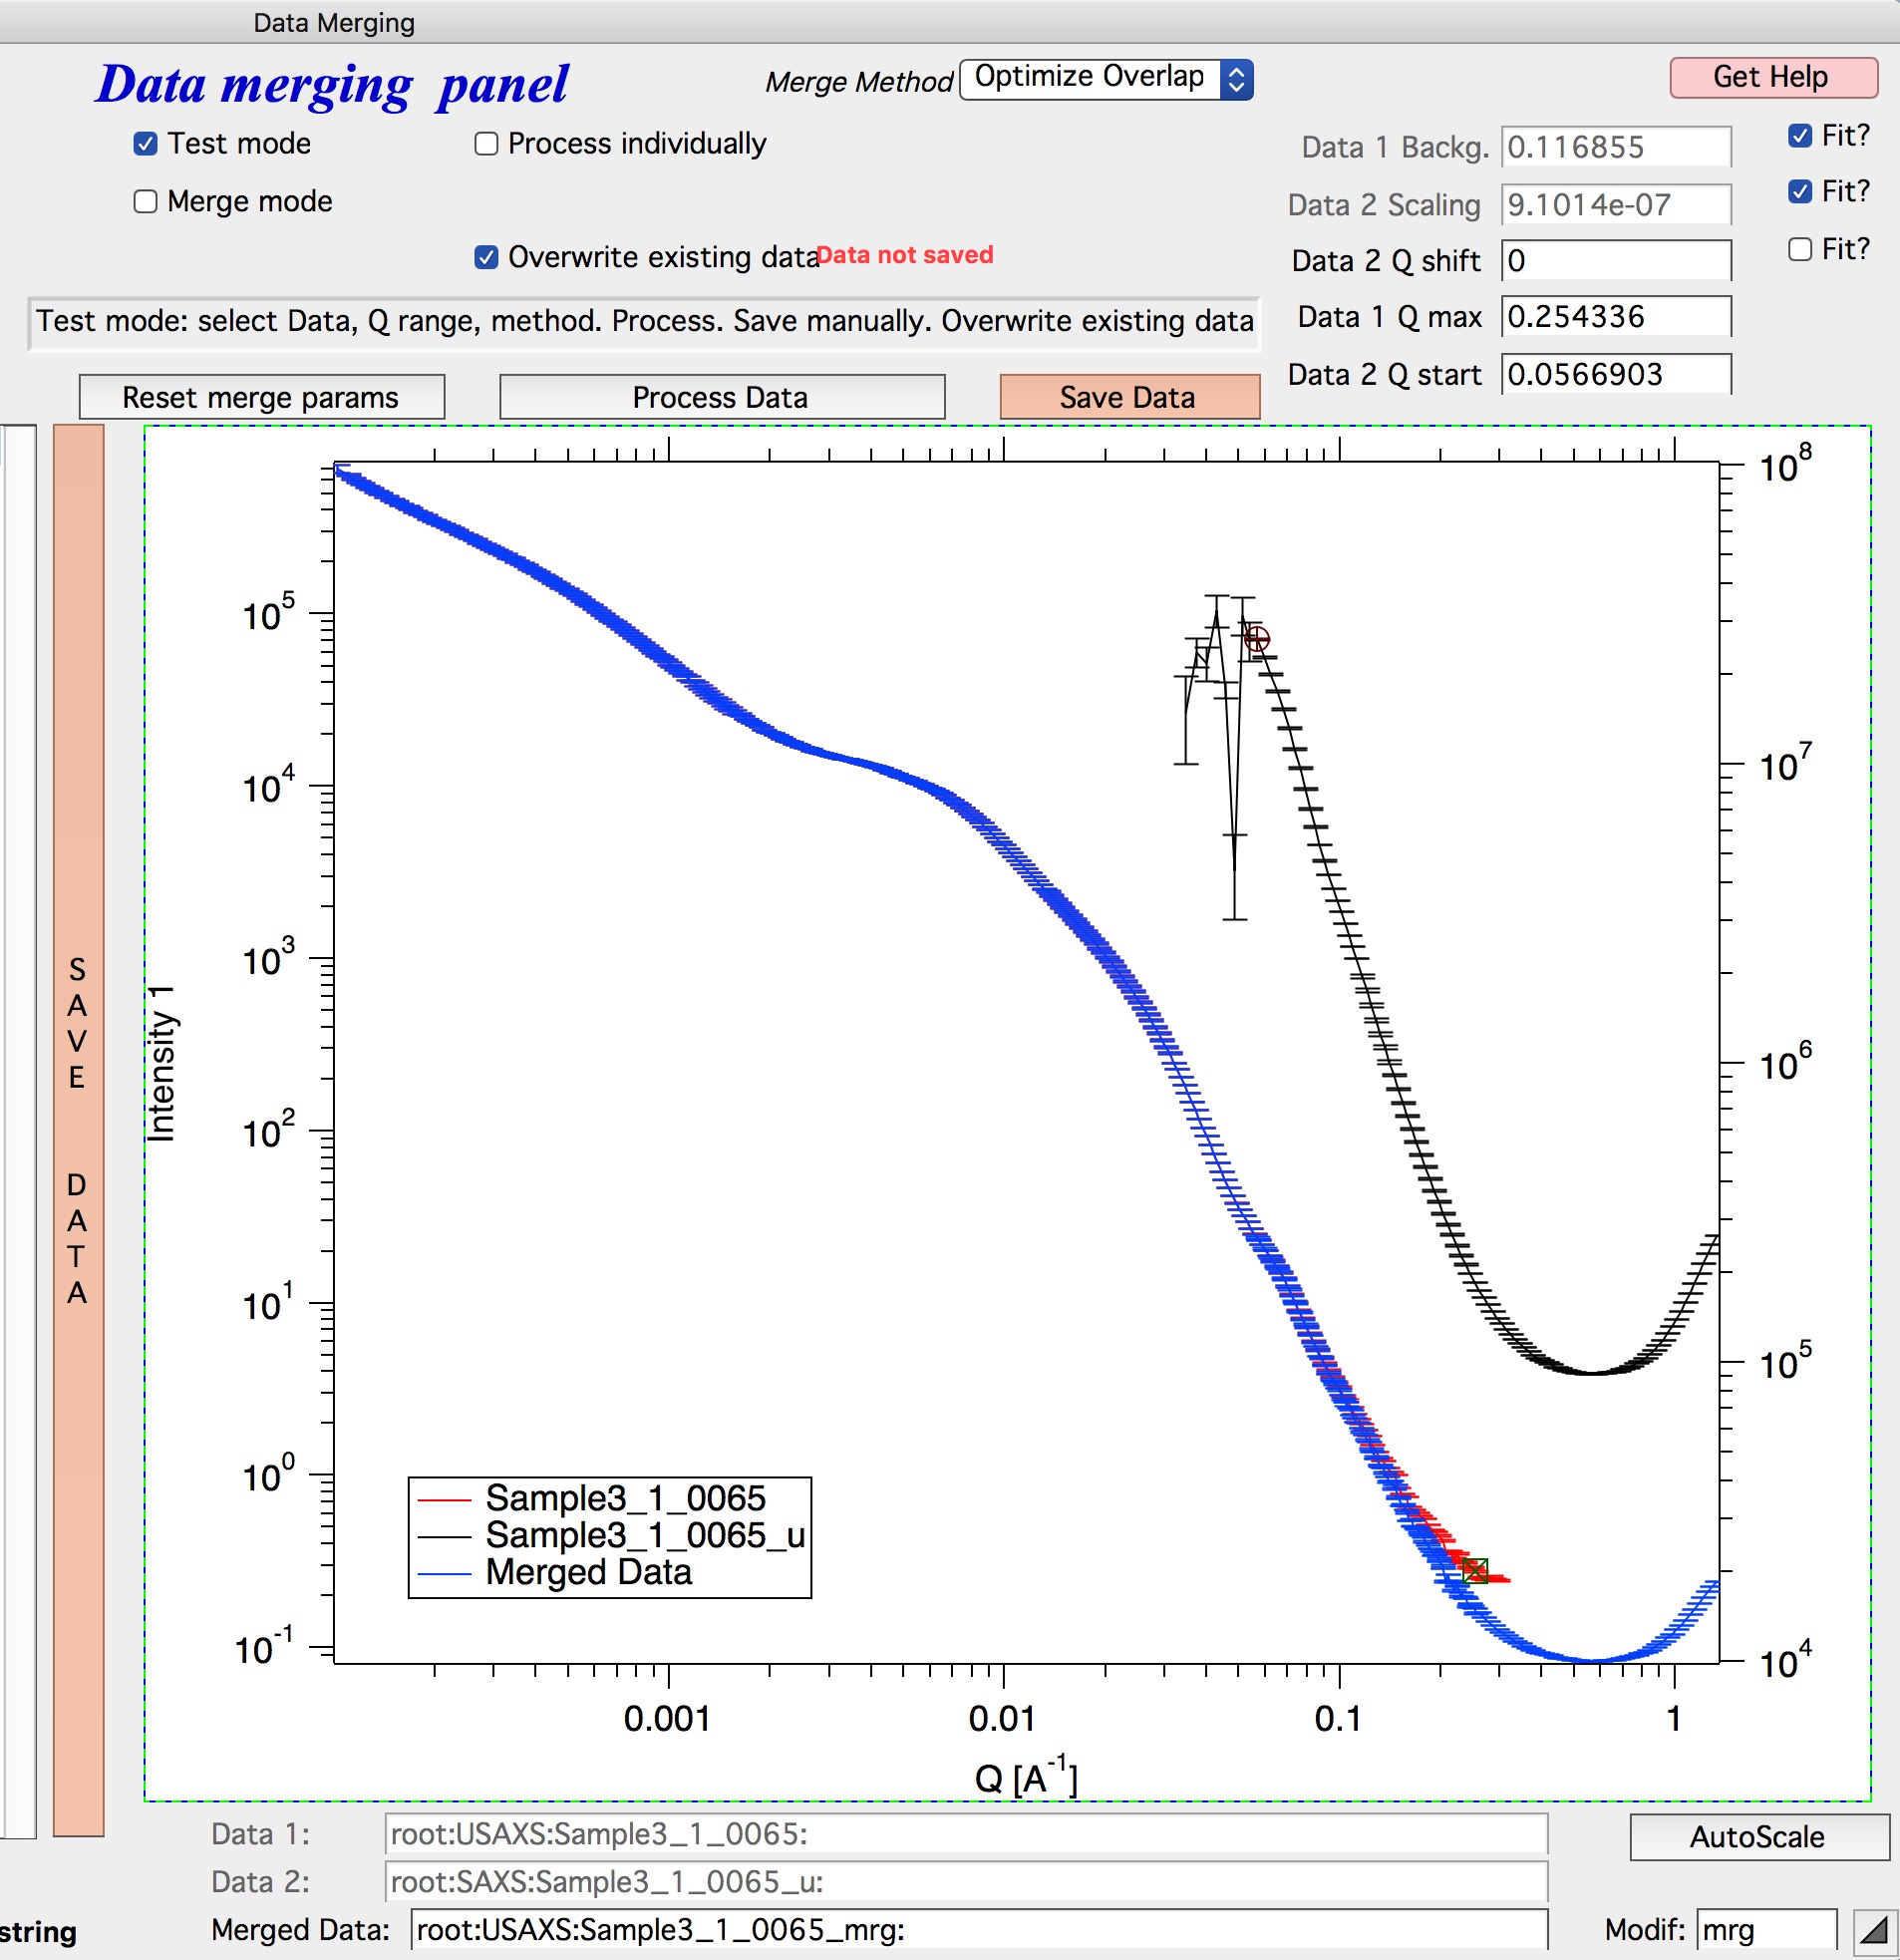
Click “Process data” to preview the merge. A blue curve shows the merged result. Adjust cursor positions as needed until the overlap looks correct.
Saving merged data
After a satisfactory merge, you have several options:
Click “Save data” (shown in orange until saved) to save the current merged dataset.
Enable “Merge mode” and use “Process data” interactively — double-click a pair of datasets from the left and right columns, and the code processes and optionally saves them automatically.
For batch merging, select ranges of files in each column and use “Process and save data”. The code pairs the first file from the left column with the first from the right column, the second with the second, and so on. Selections in the two columns do not need to occupy the same rows. See Data Merge tool in the Irena manual for full details.