Sample Plate Setup tool
Most users of this instrument have many samples to measure. Over time a variety of sample holders have been developed that can accommodate up to 100 samples at once. The Sample Plate Setup tool described here is part of the Indra (USAXS) package, available since the September 2020 release.
Purpose
This tool allows users to pre-fill one or more Sample Tables and send them to the instrument ahead of their measurements. The same tool can be used at the beamline to fine-tune measurement positions using radiography and to export the command file. This avoids the need to type sample names and positions at the beamline during beam time, making the process less error-prone and more time efficient.
How to plan an experiment (and sample plate)
The appropriate sample plate (sample holder) depends on sample type (solid, powder, liquid), sample dimensions, required conditions during shipping, measurement, and storage, and sample fragility. Discuss your needs with beamline staff and consult the sample environments page (https://usaxs.xray.aps.anl.gov/documentation/sample-environments) to select the right holder. That page is updated regularly as sample plates are developed or changed — check it even if you have used the instrument before.
Once you have selected a suitable sample plate, contact instrument staff at usaxs@aps.anl.gov at least 3 weeks before your experiment and request the appropriate number of plates to be shipped to you. Alternatively, use the drawings on the sample environments page to 3D-print your own or have one machined. Receive the plates at least two weeks before your experiment begins.
Planning considerations:
Each sample (or Blank) takes approximately 4 minutes: ~120 seconds for USAXS and 20–30 seconds each for SAXS and WAXS. Survey, calibration, and radiography overhead adds time — allow 5–6 minutes per sample, giving roughly 10 samples/hour or up to ~80 samples/shift. Minimize unnecessary sample stage movements.
A suitable instrument background measurement (“Blank”) is required for approximately every 5–10 sample measurements. The Blank is everything in the beam except the sample. For example: for powder in Scotch tape, the Blank is an empty Scotch tape pouch; for a suspension in water, the Blank is water in the same capillary/NMR tube without the suspended material. Consult staff if in doubt — correct Blank measurement is essential.
Distribute Blank measurements throughout the run: Blank → samples → Blank → samples, and so on. Do not collect all Blanks at the start or end.
Without a suitable Blank, no useful data can be obtained. Background is significant and must be subtracted; calibration also requires Blank data.
Provide correct sample thickness in millimeters. Data from the USAXS instrument are on absolute intensity scale when the correct thickness is entered. For samples that cannot be placed on absolute scale (powders, etc.), set thickness to 1 mm.
Mount samples on the plates, using the predefined Template if one exists (see below). Horizontal position at the instrument is called SX and vertical is SY. An obvious reference feature on each plate is designated SX=0, SY=0 (typically the top-right corner), and all distances are measured in millimeters from that position.
Samples must survive shipping. Secure them adequately and label each one so that it can be remounted if it falls off. Scotch Magic tape is preferred for mounting: it has low background signal and no diffraction peaks (unlike Kapton, which has diffraction peaks in the SAXS range).
Fill the Sample Table while mounting (or after mounting is complete):
Enter names and positions manually by typing into the table.
If a plate image is available, enter all sample names in the table first (including Blanks distributed throughout the run), then right-click in the image at each sample position to assign coordinates.
At the beamline, use the Beamline Survey tool to add and fine-tune positions interactively.
If all samples have the same thickness (or thickness is unknown), set the default thickness in Options Controls and leave the Thickness column empty; fill in only differing thicknesses where needed.
Sample names must be valid instrument filenames: string starting with a letter, no spaces, only letters, numbers, and
_. Names entered in the table are checked and cleaned automatically.Use the right-click menu on the Sample Table for many useful bulk operations (described below).
Verify positions and names. If a plate image is available, use it to confirm that each row’s red marker corresponds to the correct physical sample position.
Warning
Save the position set and the Igor experiment with a clear, meaningful name before sending anything to staff. If you have Plate #5 and Plate #6, save them as “Plate_5” and “Plate_6”. Use a unique, identifiable name for the Igor experiment (e.g., your name or GUP number). For mail-in experiments, email the Igor experiment to staff. For remote access, use NX file transfer. Do not email command files — these are generated at the beamline after verifying sample positions with radiography.
Practical shipping and safety reminders:
Label all samples so they can be identified if they fall off.
Keep sample locations as simple as possible.
Package suitably for shipping; use bubble wrap where appropriate.
Ship with at least two days to spare. There is no weekend delivery at ANL — samples for Monday must arrive by Thursday morning at the latest.
Send staff all required safety and chemical information.
For remote operations, submit the ESAF at least 14 days before your experiment. Mail-in ESAFs are handled by staff — provide safety and chemistry information well in advance.
Tool description
To start the tool, select Setup Sample Plates from the USAXS menu.
The panel is divided into the following areas:
Top Controls
Sample Table tab
Options Controls tab
Export Controls tab
Bottom area with output buttons
Last Info/Warning message field
Controls in each area are described below. The main purpose of the tool is to help users fill the Sample Table with sample names, SX/SY positions, and thickness values. At the beamline, the tool also supports position survey and command file export.
Users can create multiple Position Sets, each stored under a user-selected name within a single Igor experiment. Position sets can be restored, edited, and re-exported. A single Igor experiment can therefore contain position sets for all sample plates in an experiment.
Top selection controls
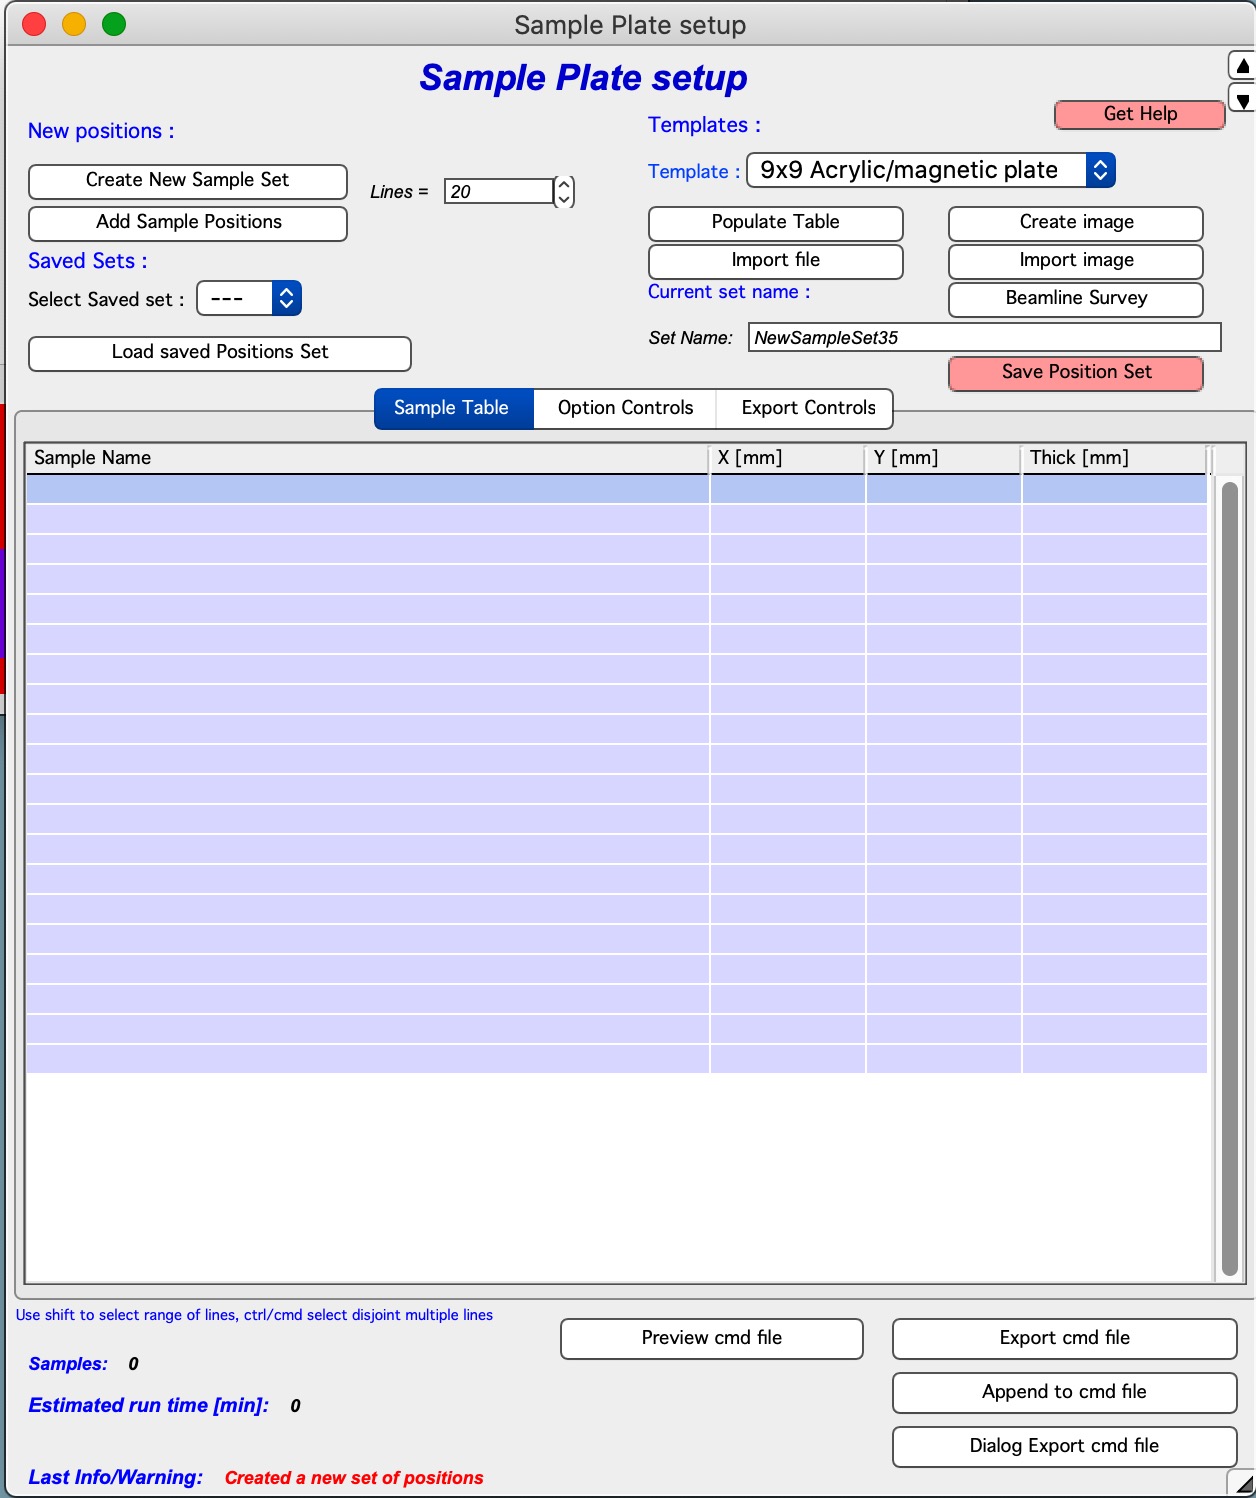
“Create New Sample Set” — Creates a new empty Sample Table. Uses the “Lines =” value to set the number of rows (default: 20).
“Add Sample Positions” — Appends additional rows to the current Sample Table. Also uses the “Lines =” value.
“Templates” — If the selected sample plate is one of the predefined templates (e.g., the 9×9 Acrylic/magnetic plate), this button populates the table with predefined center positions. A “Generic grid holder” option prompts for starting SX/SY, step sizes, and grid dimensions, then generates a rectangular grid of positions.
“Create image” — Creates a scaled image of the sample plate for those templates that support it. See the Image section below.
“Import image” — Imports a camera image (JPG, TIFF, PNG, etc.) of a custom sample plate and guides you through cropping, scaling, and straightening it for use with the position survey features.
“Select Saved set” — Selects a previously saved Position Set for loading.
“Load saved Position Set” — Restores a saved Position Set into the table. The existing table contents are overwritten — save your work first.
“Beamline survey” — Opens the Beamline Survey panel, available only on beamline computers. Described in the Beamline Survey section below.
“Current set name” — Name for the current Position Set. A random name is generated initially. Change it to something meaningful (e.g., “AcrylicPlate5”) that clearly identifies the plate.
“Save Position Set” — Saves the current Sample Set in the Igor experiment. The button is disabled if no changes have been made since the last save.
Example workflow
Assume you have received two Acrylic plates and want to populate a table for each:
Start the tool.
Select the correct Template (e.g., “9×9 Acrylic/magnetic plate”, the default).
Click “Populate table” (the required number of rows is added automatically).
Click “Create image”.
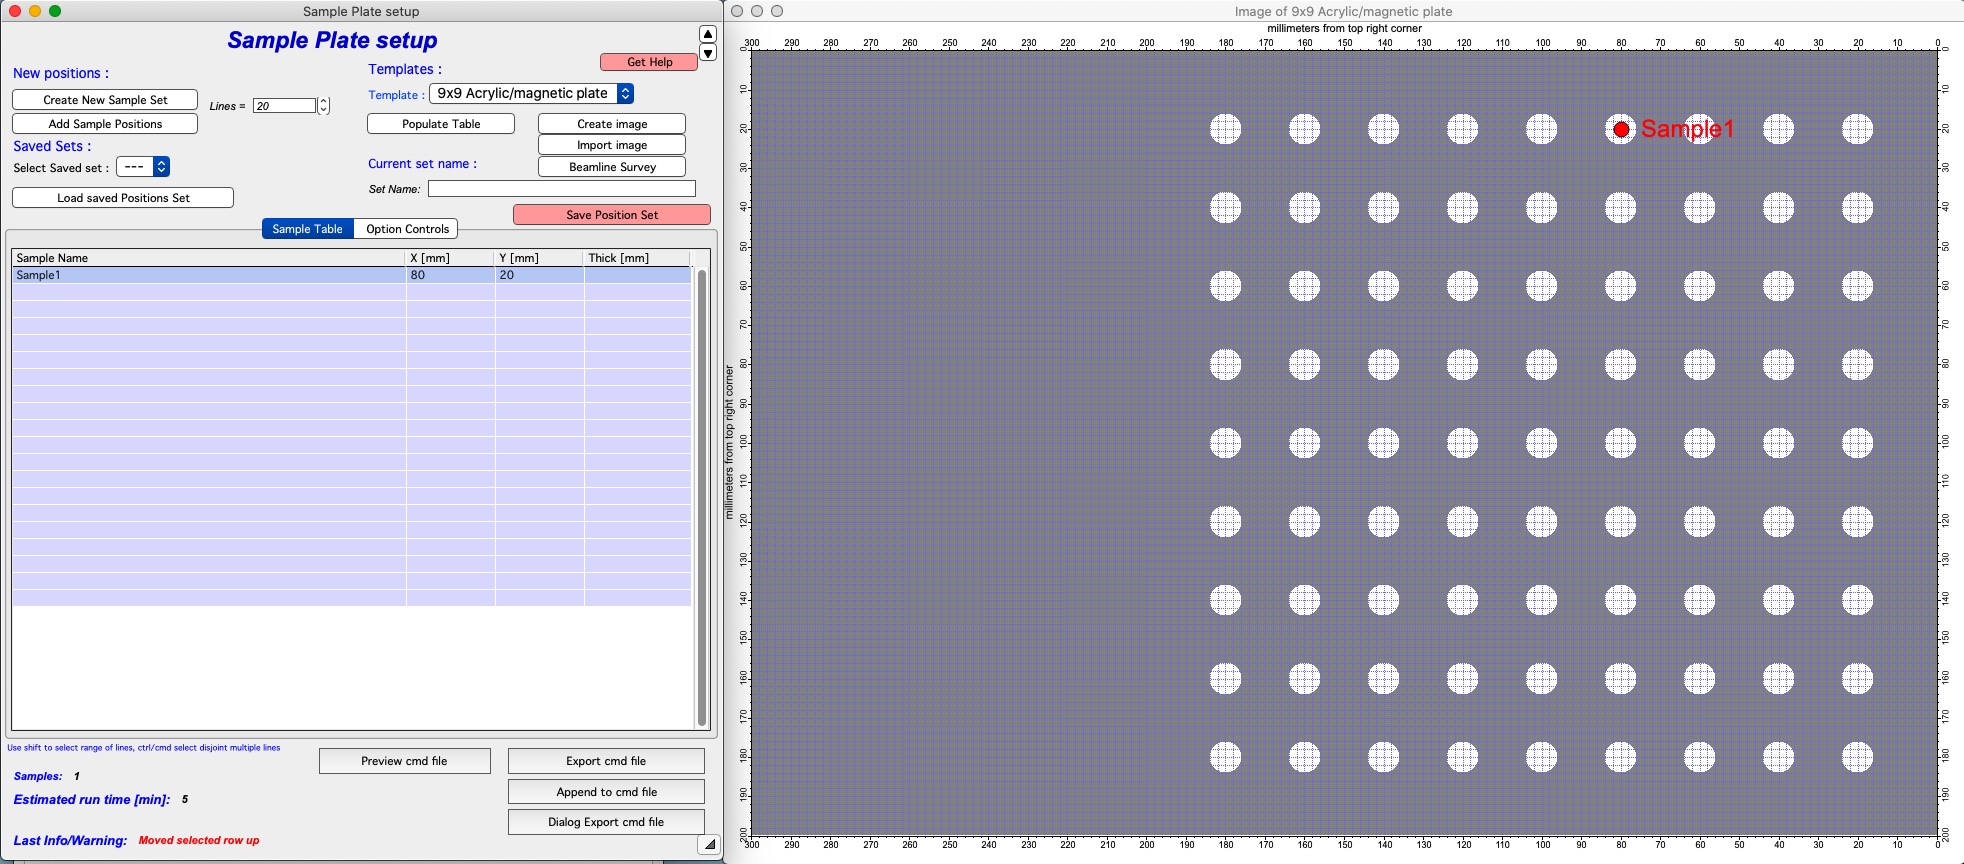
The table is pre-filled with center positions for each sample slot, indexed in millimeters from the top-right corner (SX=0, SY=0). The first two positions are reserved for beamline use. The red marker in the image shows the position of the currently selected table row.
Set the Current set name to a clear identifier (e.g., “Plate5”).
Click Save Position Set.
Repeat steps 3–6 for the second plate.
Verify your work: move row by row to check that each red marker matches the physical sample location. Or, in the Options Controls tab, enable “Display all samples in image” to show all positions at once.
Save the Igor experiment with a meaningful name (e.g.,
MyName_USAXS_20200805.pxp) and send it to staff, or transfer it to the beamline control computer via NX or a shared Box folder.
Sample Table
Each row contains the four values required by the instrument:
Sample name — Must be a valid filename: starts with a letter, uses only letters, numbers, and
_, and is at most 40 characters. The system corrects non-conforming input automatically.SX — Horizontal measurement position in millimeters from SX=0.
SY — Vertical measurement position in millimeters from SY=0.
Thickness — Sample thickness in millimeters, used for absolute intensity calibration. If left empty, the default from Options Controls is used.
Note
Any row with an empty Sample Name is treated as an empty row and is skipped when the command file is generated. You can leave unused rows in the table or delete them.
The right-click menu on the Sample Table provides many useful operations. You can select one row, a contiguous range (Shift-click), or multiple disjoint rows (Ctrl/Cmd-click).
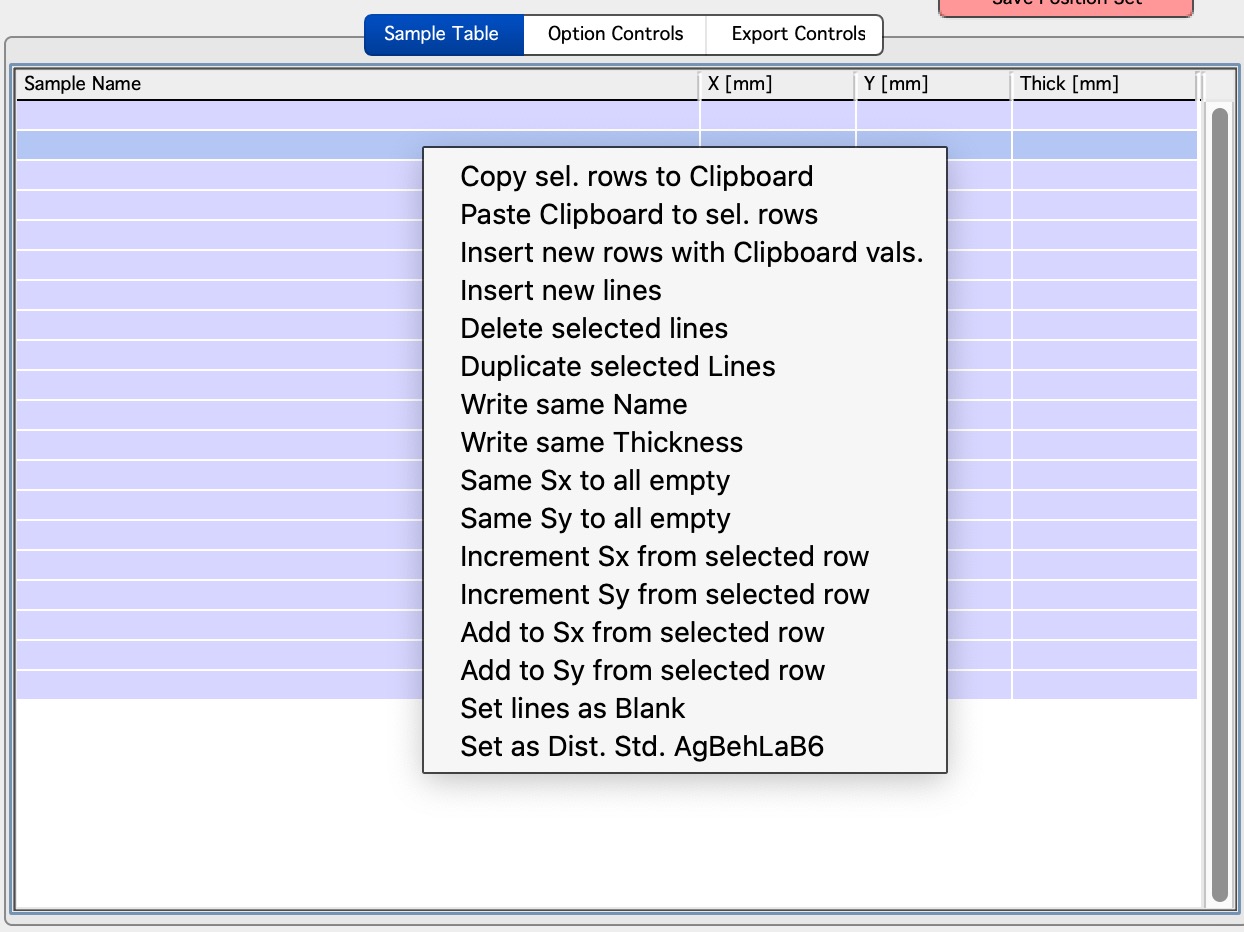
“Copy sel. rows to Clipboard” — Copies selected rows to the Table Clipboard, overwriting any previously stored content. Only one Clipboard is available.
“Paste Clipboard to sel. rows” — Pastes stored rows into the selected rows. When the Clipboard contains a single row, that row’s content is pasted into each selected row. When multiple rows are stored, they are pasted in order into the same number of selected target rows.
“Insert new rows with Clipboard vals.” — Inserts new rows below the top selected row and fills them with the Clipboard contents. When multiple rows are selected, only the top selected row’s position is used.
“Insert new lines” — Inserts one empty row at the selected position, shifting subsequent rows down.
“Delete selected lines” — Deletes selected rows; remaining rows shift up.
“Duplicate selected lines” — Inserts a copy of the selected row immediately below it. Useful for measuring the same sample at nearby positions.
“Write same Name” — Prompts for a string and target range, then writes that string into all specified Sample Name fields.
“Write same Thickness” — Prompts for a value and target range, then writes that thickness into all specified Thickness fields.
“Same Sx to all empty” — Prompts for an SX value and fills it into all currently empty SX fields. Existing values are not changed.
“Same Sy to all empty” — Prompts for an SY value and fills it into all currently empty SY fields. Existing values are not changed.
“Increment Sx from selected row” — Takes the SX value of the selected row, prompts for a step size (which may be negative), and fills incremented SX values into all rows below.
“Increment Sy from selected row” — Same as above for SY.
“Add to Sx from selected row” — Adds a constant offset to each SX value from the selected row downward.
“Add to Sy from selected row” — Adds a constant offset to each SY value from the selected row downward.
“Set lines as Blank” — Writes “Blank” into the Sample Name field of the selected rows.
“Set as Dist. Std. AgbehLaB6” — Writes “AgBehenateLaB6” into the Sample Name field of the selected rows.
Options Controls
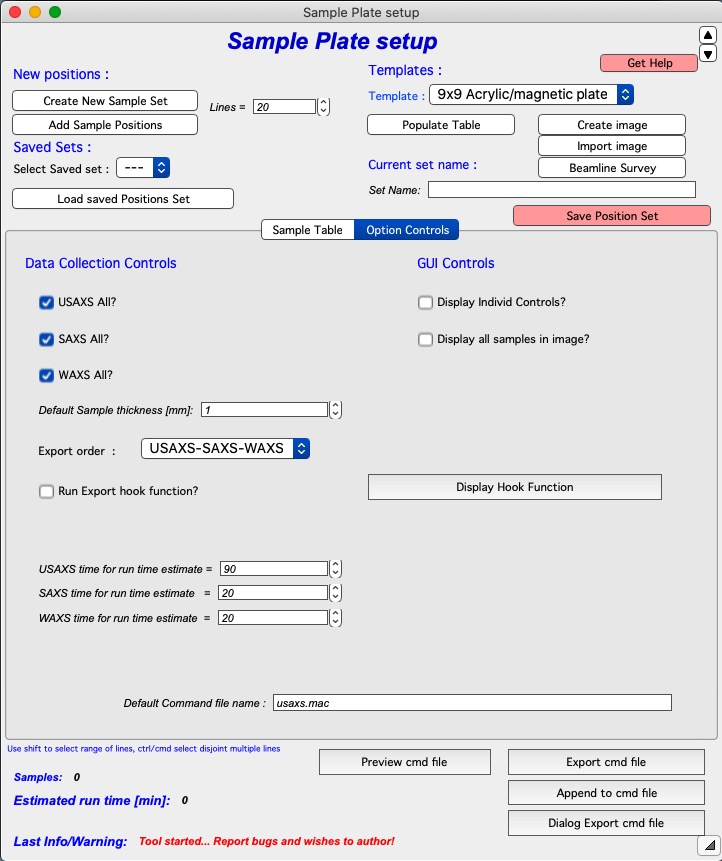
“USAXS All?”, “SAXS all?”, “WAXS all?” — Select which measurement segments to collect for all samples. Uncheck any segment that is not needed.
“Default sample thickness” — Default thickness applied to rows with an empty Thickness column.
“Export order” — Controls the order in which segments are collected (default: USAXS–SAXS–WAXS).
“Run Export Hook function?” — Enables a user-modifiable hook function that can modify table entries when writing the command file (see Hook function below).
“USAXS time, SAXS time, WAXS time” — Times used to calculate the estimated total run time shown at the bottom of the panel. These values are not sent to EPICS; set measurement times in EPICS separately.
“Default Command file name” — Do not change unless you have a specific reason to do so.
“Display individual controls” — Enables per-sample selection of which measurement segment(s) to run. This is rarely needed; consult staff before using.
“Display all samples in image” — Shows red markers and names for all samples in the table simultaneously on the plate image.
Hook function
For non-standard data collection patterns, enable “Run Export hook function?” and modify the hook function in your Igor experiment. Click “Display Hook Function” to copy the function template into the main Procedure window for editing. The example below measures five positions per sample (center plus offsets in four directions):
override Function IN3S_ExportHookFunction(listWaveG, LBSelectionWvG)
    wave listWaveG, LBSelectionWvG
    //  Modify this function as needed.
    //  IN3S_WriteListOfCommands(listWaveG, LBSelectionWvG, sxOffset, syOffset, TitleModifier)
    //  1. Keep wave names listWaveG, LBSelectionWvG unchanged.
    //  2. Change sxOffset and syOffset [mm] (added to sx and sy from the table).
    //  3. Change TitleModifier (appended to the sample name).
    //  4. Ensure "Run Export Hook function" checkbox is checked and procedures are compiled.
    IN3S_WriteListOfCommands(listWaveG, LBSelectionWvG, -1,  0, "_R")  // right
    IN3S_WriteListOfCommands(listWaveG, LBSelectionWvG,  0, -1, "_T")  // top
    IN3S_WriteListOfCommands(listWaveG, LBSelectionWvG,  1,  0, "_L")  // left
    IN3S_WriteListOfCommands(listWaveG, LBSelectionWvG,  0,  1, "_B")  // bottom
end
Export Controls
The typical workflow is to prepare and save one or more Position Sets, then export them one at a time to a command file.
For experiments requiring multiple Position Sets to be combined into a single command file, the Export Controls tab provides a drag-and-drop interface:
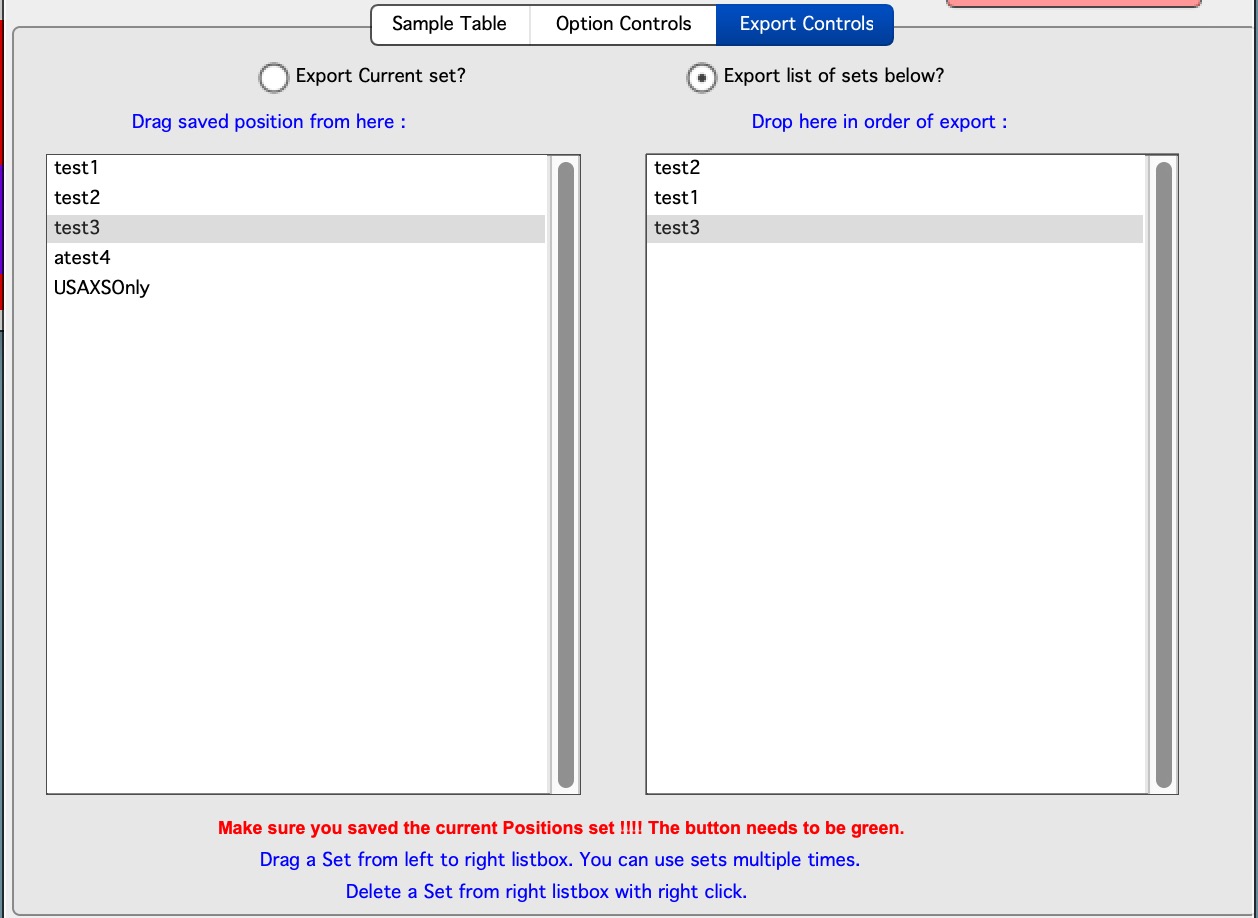
“Export Current set?” (radio button) — Exports whatever is in the current Sample Table when Export, Append, or Preview buttons are used. This is the default behavior.
“Export list of sets below?” (radio button) — When selected, shows two list boxes: available saved Position Sets on the left, and the export order on the right. Drag names from left to right to build the export list. Right-click in the right list to delete entries. Position sets can appear multiple times in the export list.
When you click Preview, Export, or Append with a list configured, the tool:
Saves the current table content temporarily.
Loads the first Position Set from the list and generates output using that set’s saved Options settings.
Loads each subsequent set and appends to the output.
After all sets are processed, restores the original table content.
Applies the combined output to whichever action button was pressed.
Note
Save the current Position Set before using this feature. Each set has its own saved Options settings. Use the Preview button to verify the combined output before exporting.
Bottom controls
“Preview cmd file” — Opens an Igor notebook displaying the command file for inspection.
“Export cmd file” — Saves the command file to your Desktop as the file named
in the Default Command file name field (usaxs.mac is strongly recommended).
On beamline computers (usaxspc7 or usaxspc11), the file is also automatically
transferred to the instrument working directory via SFTP.
“Append to cmd file” — Appends the current Sample Table’s commands to an existing command file on the Desktop. Use this to combine multiple tables: export the first table with Export cmd file, then use Append to cmd file for each additional table.
“Dialog Export cmd file” — Opens a Save As dialog so you can choose the output location and filename.
“Estimated run time [min]” — Estimated total collection time based on the USAXS, SAXS, and WAXS times specified in Options Controls.
“Last Info/Warning” — Reports the last action taken by the tool. Useful for operations that have no other visible response.
Image
The plate image provides visual guidance when mounting samples. For supported templates, click Create image to generate the image. To use a custom holder, use Import image to import and scale a camera photograph (see Import image section below).
Right-clicking in the image provides two options:
“Write position” — Writes the clicked SX/SY coordinates into the currently selected row in the Sample Table.
“Append line with position” — Appends a new row at the end of the table with the clicked coordinates.
The image displays calibrated millimeter axes and grid lines and can be zoomed without loss of functionality.
Survey at the beamline
At the beamline, the “Beamline survey” button opens an additional panel for fine-tuning sample positions using radiography.
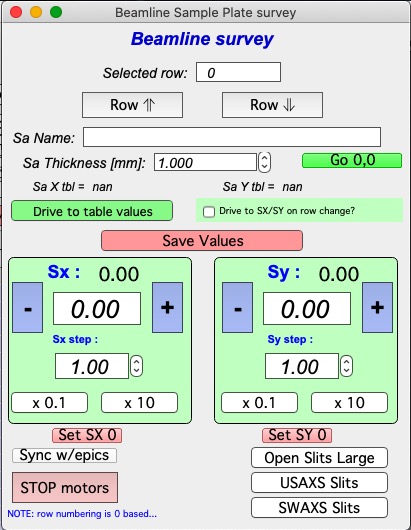
The top section displays values for the currently selected row in the Sample Table. “Row down” and “Row up” buttons step through rows. Selecting a different row in the Sample Table also updates this panel. When the last row is reached, clicking “Row down” adds a new empty row.
“Sa Name” and “Sa Thickness” — Sample name and thickness from the table. Editable here; clicking “Save Values” copies them back to the table.
“Sa X tbl” and “Sa Y Tbl” — Read-only display of the SX/SY values from the table.
“Drive to table values” — Moves the instrument SX and SY motors to the table values. Works only if both SX and SY contain valid numbers. Will not move while the instrument is collecting data.
“Drive to SX/SY on row change?” — When checked, changing the selected row automatically moves the instrument to that row’s SX/SY position.
“Go 0,0” — Moves the instrument to SX=0, SY=0.
“Save values” — Saves the current motor positions as SX/SY in the selected table row, along with any edited Sample Name and Thickness values.
Motor controls (bottom section)
Standard motor controls similar to the EPICS motor GUI. SX and SY readbacks update approximately 10 times per second.
“Step controls” — Enter a step size manually, or use the up/down arrows to change the step by ±1 mm. “x 0.1” divides the step by 10; “x 10” multiplies by 10.
“Set SX 0” / “Set SY 0” — Redefines the current SX or SY position as zero.
“STOP motors” — Issues an all-stop command to the controller. Not all motors may respond, depending on how they are controlled.
“Open Slits Large” — Opens slits to the large position for radiography.
“USAXS slits” / “SWAXS slits” — Moves slits to USAXS or SAXS/WAXS sizes.
“Sync w/epics” — Synchronizes SX and SY targets and readbacks with the current EPICS motor positions. May be needed when SX/SY are controlled from both EPICS and Igor simultaneously.
Warning
The Beamline Survey tool is disabled on non-beamline computers. Even on beamline computers, it will not move motors while data collection is active. The tool has no knowledge of EPICS limits or errors — if motors are behaving unexpectedly, check EPICS and contact staff.
Import image
Use Import image to import a rectangular sample holder photograph (JPG, TIFF, PNG, BMP, or similar), assign real-world dimensions, and create a calibrated plate image for use with position survey features.
Click Import image and select a suitable image file. All images are converted to grayscale in Igor Pro. RGB images (e.g., iPhone JPEGs) are supported.
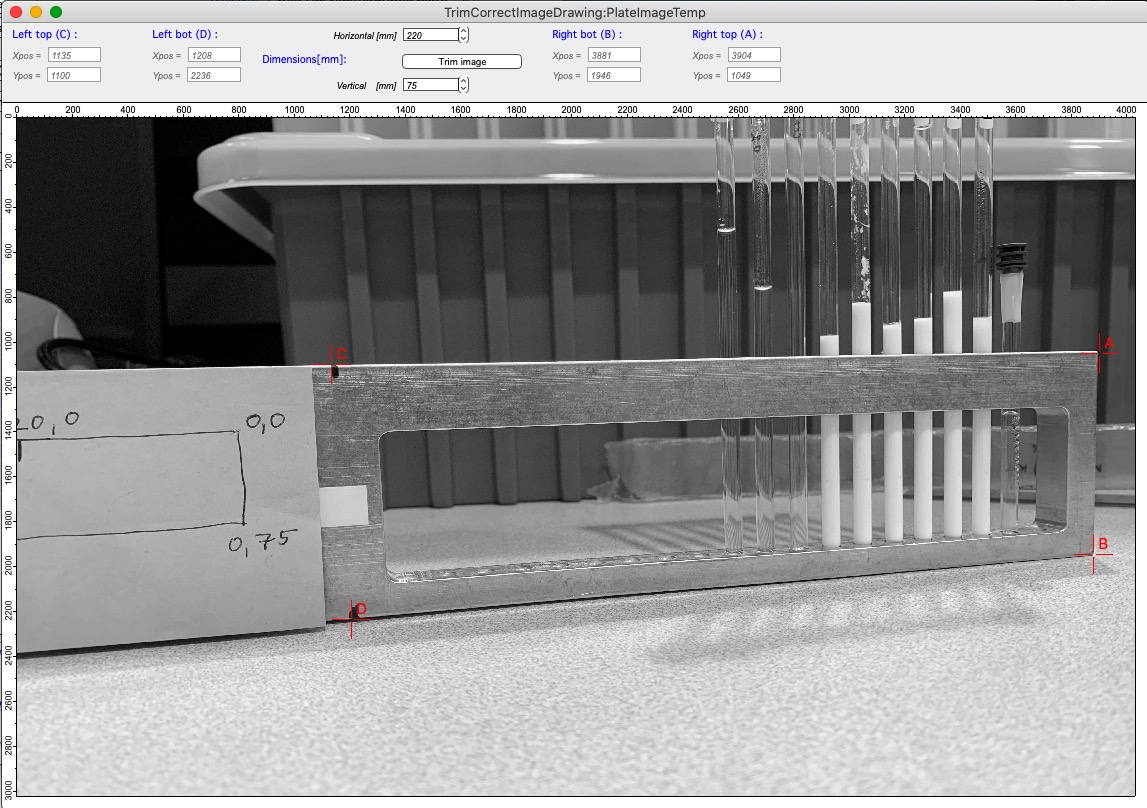
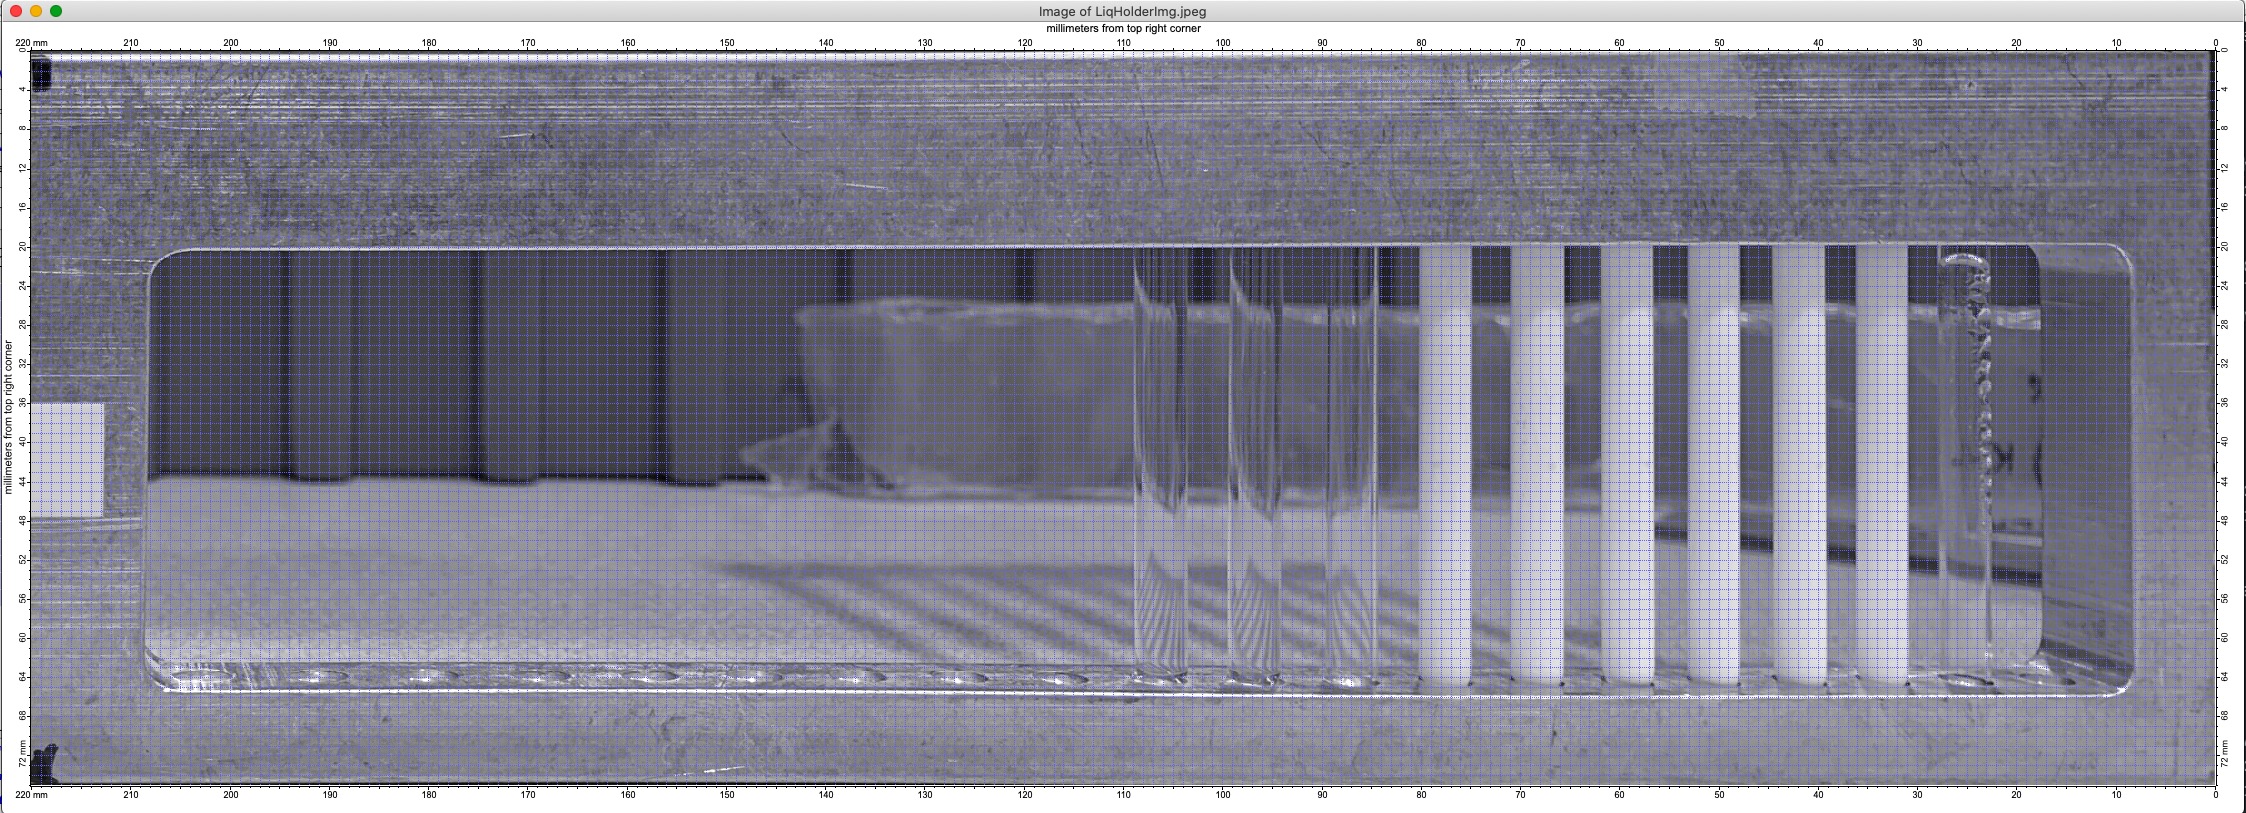
Place cursors A, B, C, and D at the corners of a rectangular region for which you know the real-world dimensions in millimeters. In the example above, the cursors mark the corners of a liquid sample holder that is 220 mm wide and 75 mm tall. The image includes perspective distortion that needs to be corrected.
Click Trim image to generate a corrected, calibrated plate image that can be used for sample position survey.