Output data
QRS — Internal Igor storage
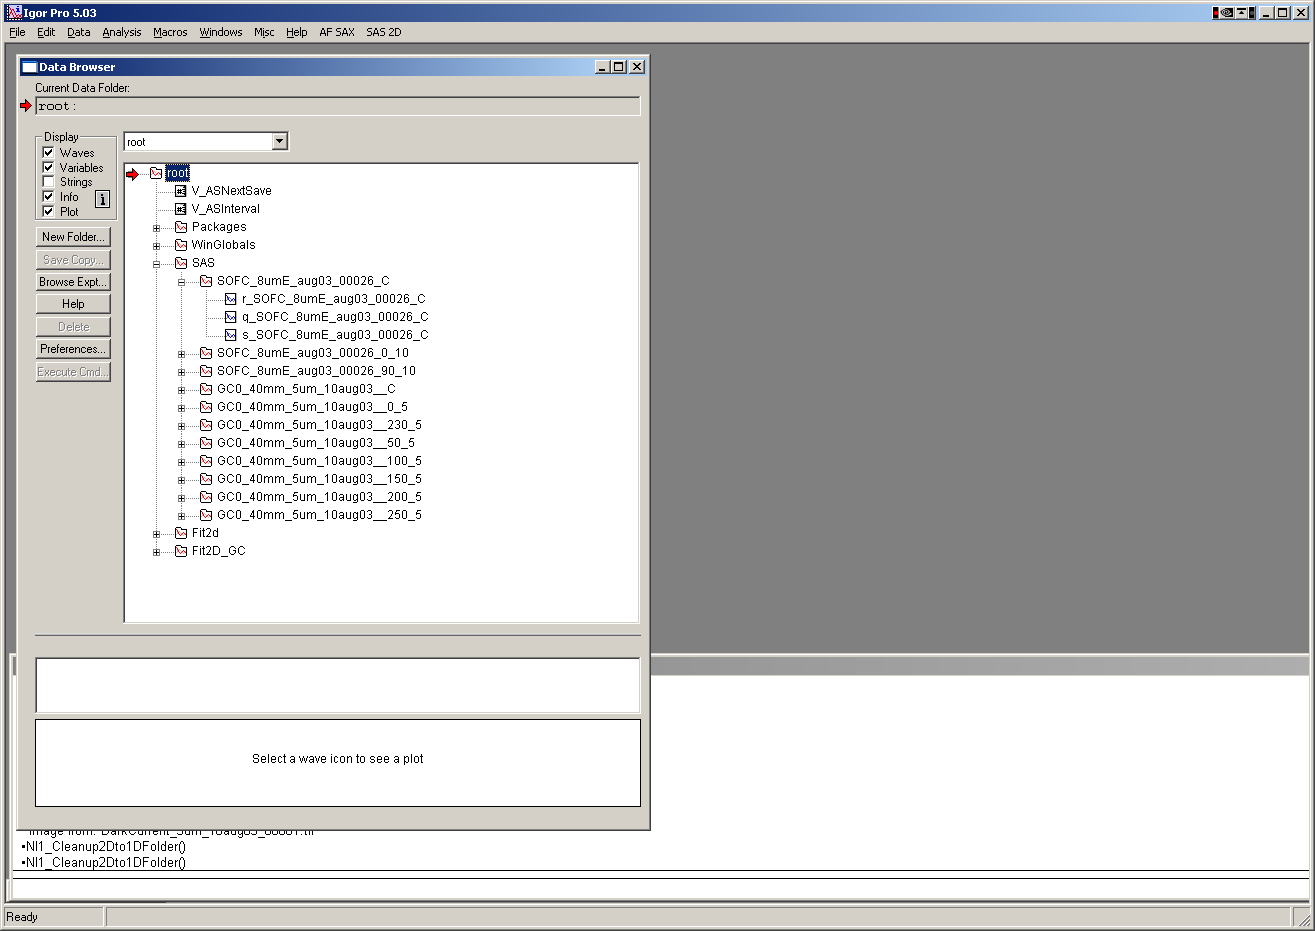
Data are stored internally within the Igor experiment (when selected) in
root:SAS:, organized in folders named by sample and integration type:
nameOfSample_C— circular averagenameOfSample_Angle_halfWidth— sector average around direction Angle with sector half-width halfWidth
Wave names
X-axis data
q_NameOfSample_C (or _Angle_halfWidth) — Q vector in Å-1
t_NameOfSample_C (or _Angle_halfWidth) — 2θ, when output is with
respect to two-theta
d_NameOfSample_C (or _Angle_halfWidth) — d-spacing, when output is
with respect to d
Y-axis data
r_NameOfSample_C (or _Angle_halfWidth) — intensity (if calibrated, in
units of cm-1; thickness is internally converted to cm)
Error
s_NameOfSample_C (or _Angle_halfWidth) — uncertainty for intensity
Other
w_NameOfSample_C (or _Angle_halfWidth) — width of each Q/d/2θ bin.
Used for LUT output and bin-width smearing. For linear binning this is
constant (Max − Min) / numOfPoints; for log binning it varies with bin
position.
Line profile data
For line profile output, wave names include a profile indicator and the Q value at which the profile was calculated. For example, a GI Vertical line profile might be named:
gc_saxs_395__GI_VLp_0.0077
where:
gc_saxs_395_— part of the source image nameGI_VLp_— GI Vertical Line profile indicator0.0077— the Qy value in Å-1
Exported ASCII files contain columns: Int, error, Q, qx, qy, qz, with a header and column labels.
Waves saved in Igor for line profiles:
r_NameOfSample_ProfileIndicator_Qvalue — intensity
q_NameOfSample_ProfileIndicator_Qvalue — Q [Å-1]
s_NameOfSample_ProfileIndicator_Qvalue — uncertainty
qy_NameOfSample_ProfileIndicator_Qvalue — Qy [Å-1]
qz_NameOfSample_ProfileIndicator_Qvalue — Qz [Å-1]
qx_NameOfSample_ProfileIndicator_Qvalue — Qx [Å-1]
(generated only for GI profiles)
Each intensity wave has an attached wave note containing useful metadata, for example:
CalibrationFormula=1*((Sa2D));CurrentMaskFileName=A mask_mask;
QvectorNumberPoints=300;CircularAverage=1;