Export data
Irena produces many datasets that are most conveniently used within an Igor experiment, but that often need to be exported to other programs. This tool exports data as ASCII or NeXus (NXcanSAS) files.
Two options are available:
Export data GUI — export one or more datasets in various formats.
Export all as NXcanSAS — export all USAXS and QRS data from the current experiment into a single NXcanSAS HDF5 file.
Export all data as NXcanSAS
This script provides a quick way to export all data from the current experiment as one NXcanSAS HDF5 file, suitable for use in tools such as SasView.
The script scans the current Igor experiment for USAXS and QRS data
types, determines the experiment’s save location and filename, and creates a new
file in the same location with _nxcansas.h5 appended. For example, an
experiment saved as MyDataReduction.pxp on the Desktop produces
MyDataReduction_nxcansas.h5. If the output file already exists, the user is
prompted before overwriting.
Q-resolution handling:
QRS data — if a dQ wave exists, it is written to the NXcanSAS file. SasView handles pinhole smearing for QRS data correctly.
USAXS desmeared data — dQ is set to zero in the output; SasView ignores it. Artifacts at the lowest USAXS Q values can occur; Irena has internal handling that prevents this, but SasView does not.
USAXS slit-smeared data — two dQ arrays are written:
dQl(set to the slit length) anddQw(instrument Q-resolution from Indra). If dQ has been zeroed by data manipulations,dQw = 0butdQlretains the slit length. SasView reads both and applies slit smearing automatically.
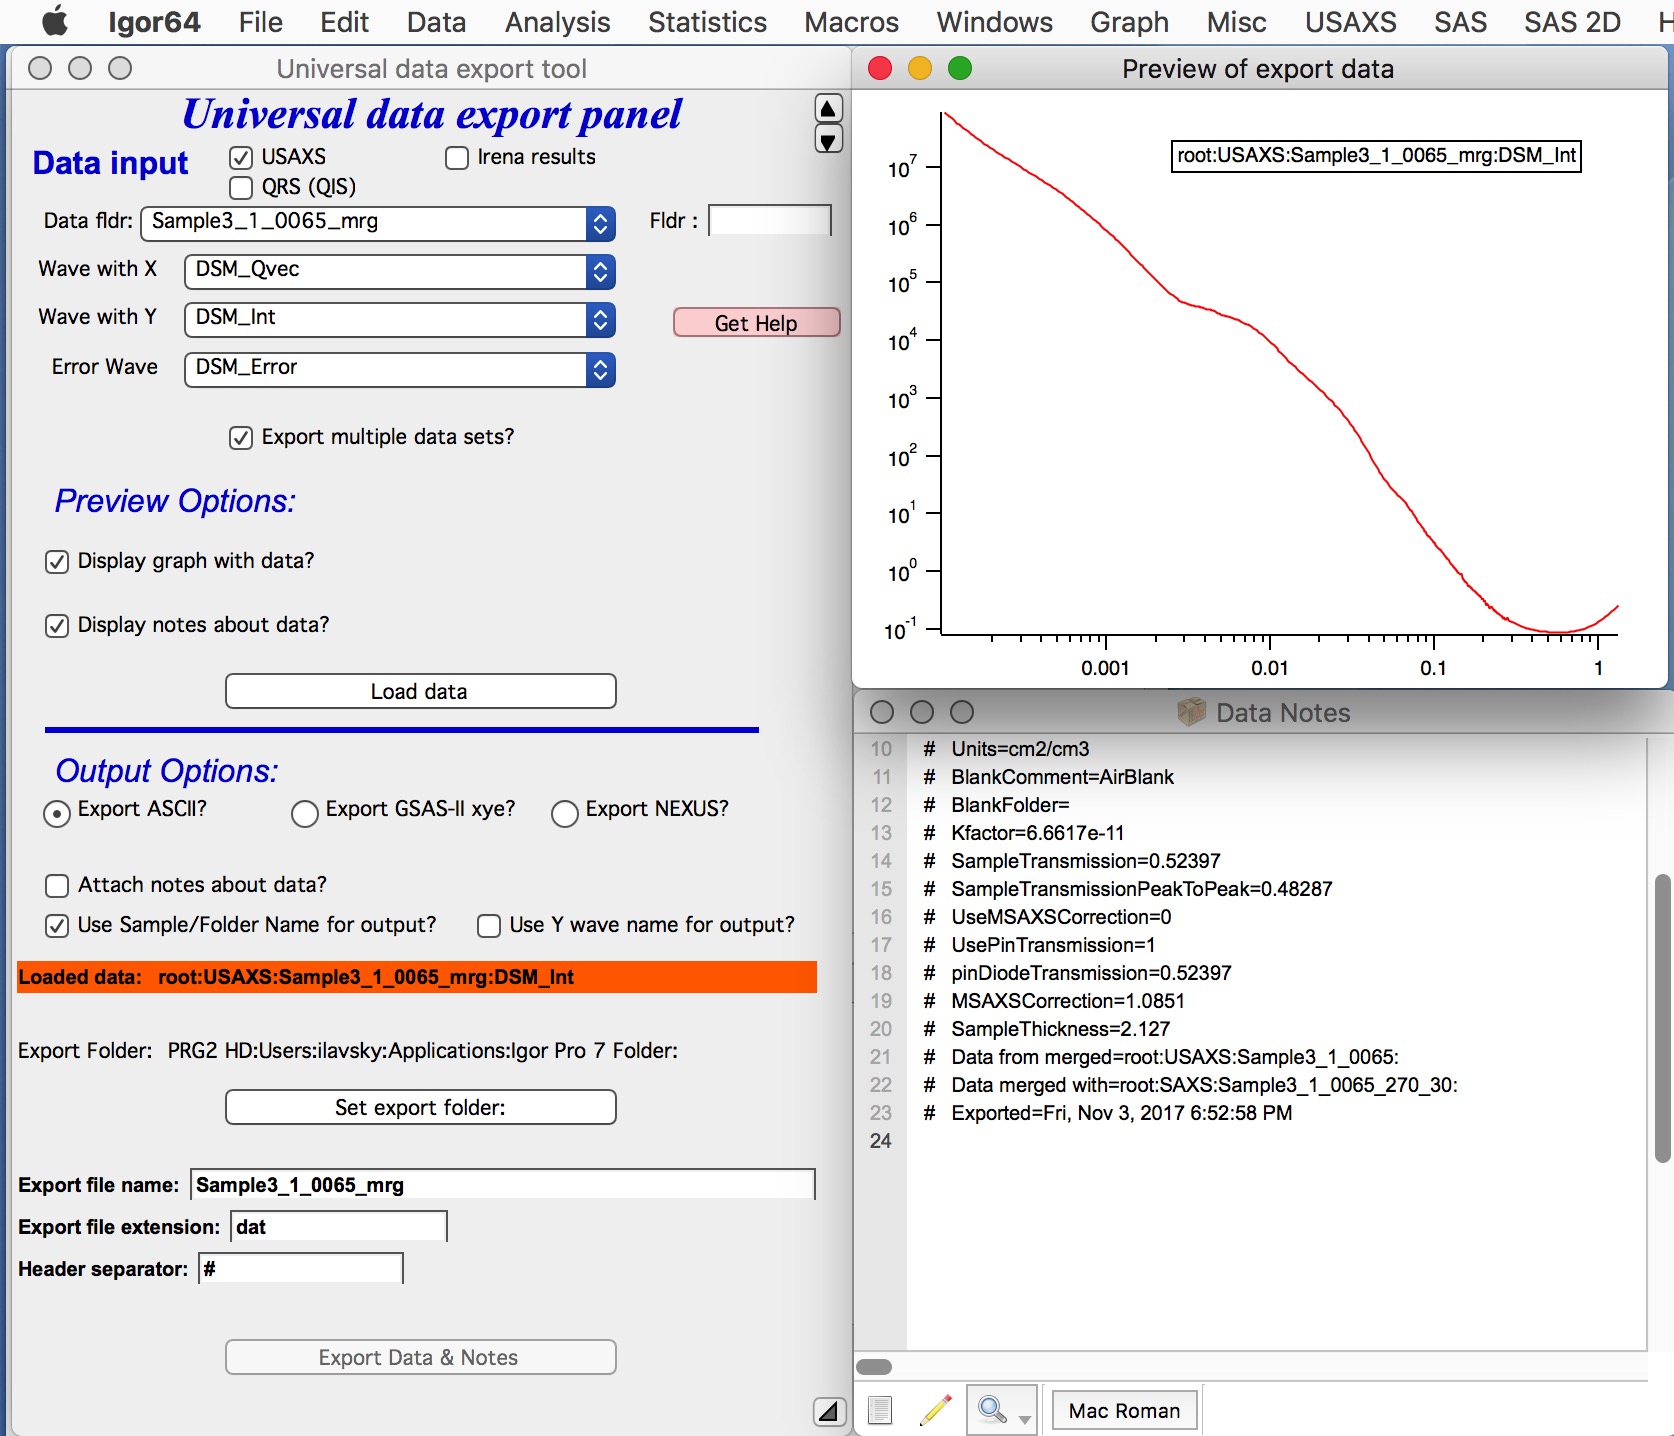
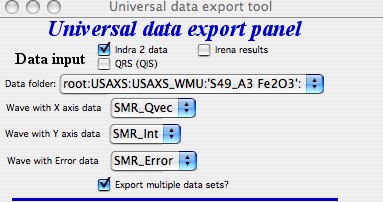
Export data GUI
This GUI exports one or more datasets — USAXS, QRS, or Irena result data — as ASCII or NXcanSAS files. It is the only straightforward way to export size distribution or other modeling results from Irena.
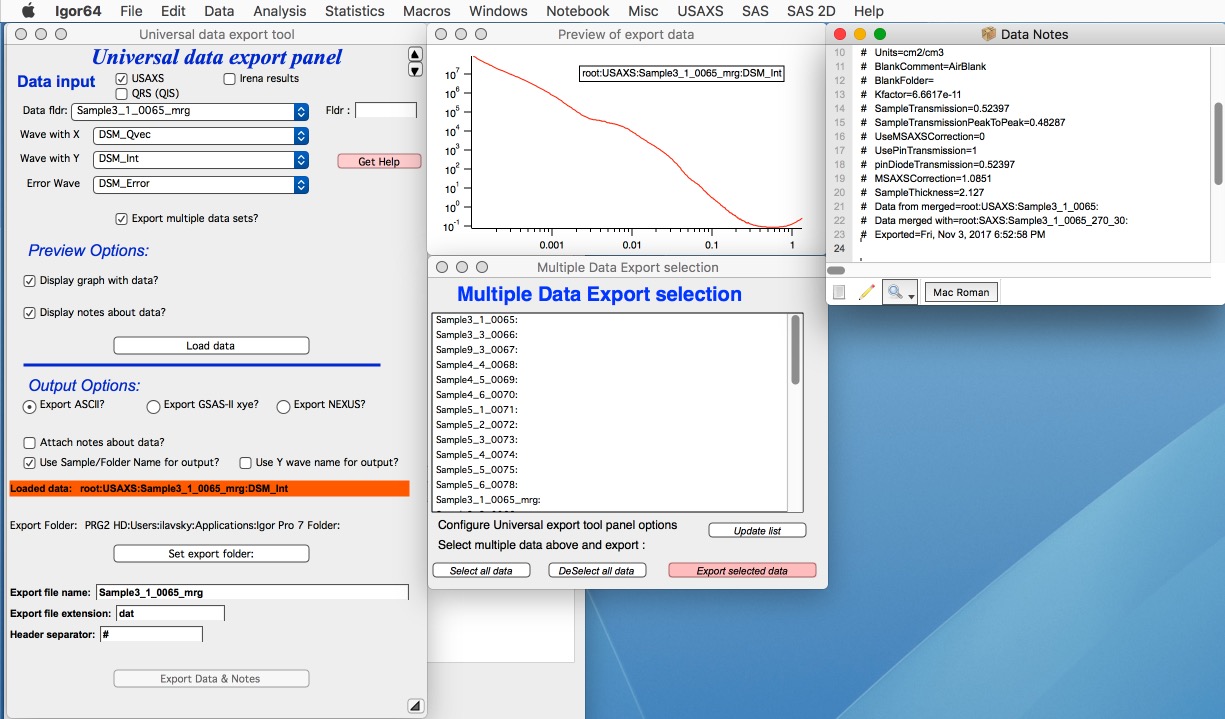
Select data in the top section of the panel. Choose whether to display a graph and any associated wave notes. Click “Load data”.
Enable “Export multiple data sets?” to open the Multiple Data Export panel for batch export. The recommended workflow is to configure and test one dataset manually first, then use the batch export for the full set.
A graph and the wave notes are displayed. The graph is not automatically formatted — modify it manually if needed.
Select the output format:
ASCII data
GSAS-II compatible (ASCII) xye data
NeXus (HDF5) data (NXcanSAS)
File format descriptions
ASCII — Tab-separated text with a header. Any X-Y-(E) data can be exported in this format: Q/Intensity/Uncertainty, size distributions, model fits, etc. No unit conversions are applied — data are exported as-is.
Note
If exporting slit-smeared USAXS data as ASCII, record the slit length in your notebook. When importing into SasView, provide the slit length as the dQl resolution value.
Standard column order: Q (or d or 2θ) | Intensity | Uncertainty | Q-resolution.
Units:
Q: Å-1 | d: Å | 2θ: degrees
Intensity: absolute scale if calibrated in Nika/Indra; otherwise relative
Uncertainty: estimated values; the method depends on settings in Nika (standard deviation, old method, or SEM)
Q-resolution: convolution of pixel size, beam size, and Q-bin width. Used by SasView and Irena Modeling for smearing. Rarely needed in practice.
For USAXS (Indra) data: uncertainties are calculated rigorously from Indra’s established method; Q-resolution is derived from instrument parameters.
GSAS-II compatible xye — ASCII formatted for GSAS-II (or similar powder diffraction packages). Converts any input x-axis (Q, d, 2θ) to two-theta plus intensity and uncertainty, with an appropriate header. Useful only for WAXS data.
NeXus (NXcanSAS) — HDF5 data file following the NXcanSAS standard. Supports machine-readable metadata; multiple sectors or profiles can be stored in a single file. Data exported and re-imported through Irena passes all metadata correctly. Compatible with SasView.
Note
For slit-smeared USAXS data exported as NeXus: dQl is set to the slit
length and dQw is set to the Indra/Nika Q-resolution. If data
manipulations have zeroed dQw, dQl still carries the slit length. SasView
reads and applies both values correctly and automatically.
Other controls
“Attach notes” — appends the wave note to the ASCII output. The separator character (field below) can be changed if a different delimiter is needed.
“Use folder names for output” — names output files after their folder names.
“Use Y wave name for output” — names output files after the Y wave name (useful for QRS data).
“Set export folder” — sets the output directory. The folder must exist before selecting; the path is shown in a red box above the button.
“Export file name” — modify the default filename if needed.
“Export file extension” — .dat for ASCII, .xye for GSAS-II,
.h5 for NeXus.
“Header separator” — for ASCII only; include spaces if desired.
“*Export Data and Notes*” — performs the export. If a file with the same name already exists in the target location, confirmation is requested before overwriting.
Multiple data set export
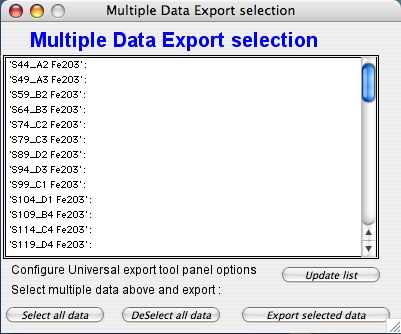
Notes:
If changes are made to the main panel after opening this sub-panel, click “Update list” to refresh the folder list.
The tool searches for data starting from the parent folder of the dataset selected in the main panel:
If data cannot be found, select a different starting folder in the main panel and update the list.
For Irena results, the tool exports only the same data generation as selected in the main panel (e.g., only
_0, or only_1, etc.). This prevents mixing results from different fitting rounds.