Scripting tool
This tool enables automated processing of large datasets through scripted runs of the following packages: Unified Fit, Guinier-Porod, Size Distribution, Modeling II, and Plotting tool I. Error messages and most user dialogs from these packages are suppressed during scripted runs.
What the scripting tool does
For each selected data folder, the tool performs the following steps for data analysis tools:
Selects the data folder, loads the data, and creates the graph (equivalent to clicking “Graph”).
Sets cursors to the same Q range as configured during the test run.
Clicks “Fit”.
Saves data according to the selections in the control panel.
For Plotting tool I, the tool:
Resets or keeps the tool state (per checkbox selection).
Adds data sets to the Plotting tool in the order listed in the panel (order is controlled by the sort options).
Clicks “Plot”.
Limitations: The data selection must uniquely identify one dataset per
folder. For QRS data this is required by structure. For USAXS data (“Indra2”),
the data type selected during testing (e.g., SMR_*, DSM_*,
M_SMR_*) must exist in all folders. Contact the developer if additional
selection flexibility is needed.
Use of the Scripting tool
First, open the target tool (Unified Fit, Size Distribution, etc.) and configure it on a representative dataset. Verify that the cursor Q range is correct for all datasets to be processed.
Open the main Scripting tool window (left: SAXS data; right: Irena results):
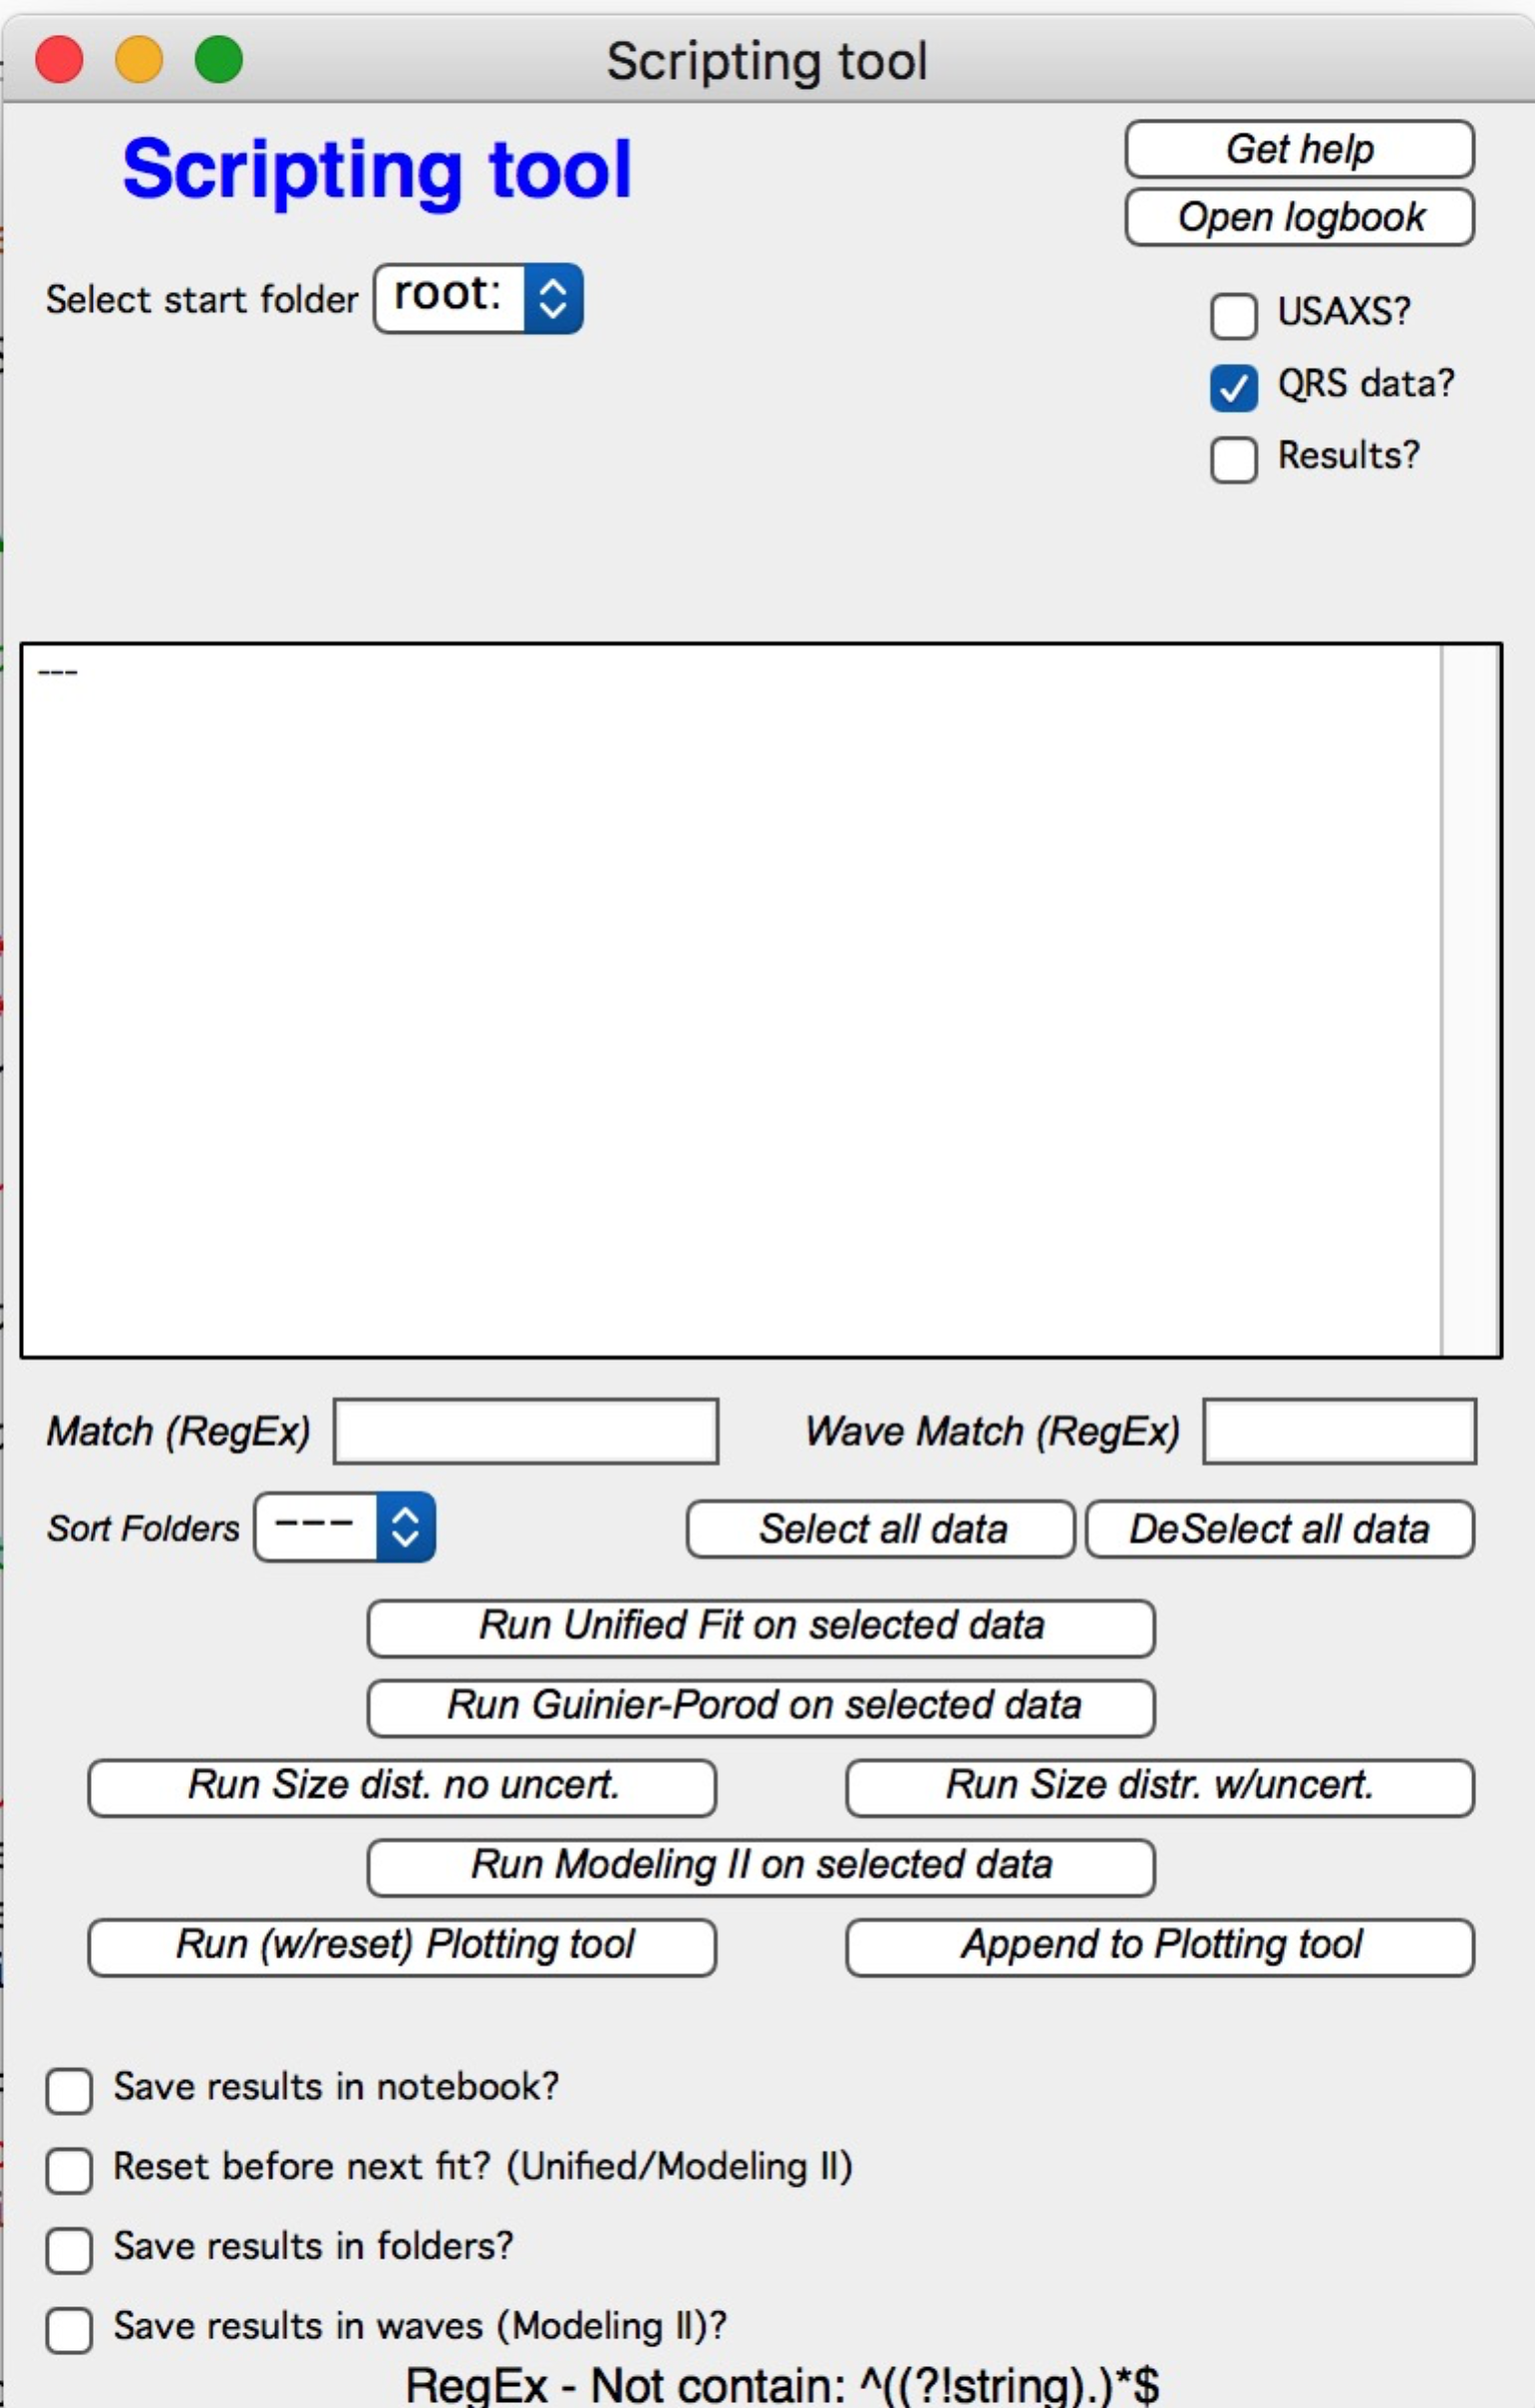
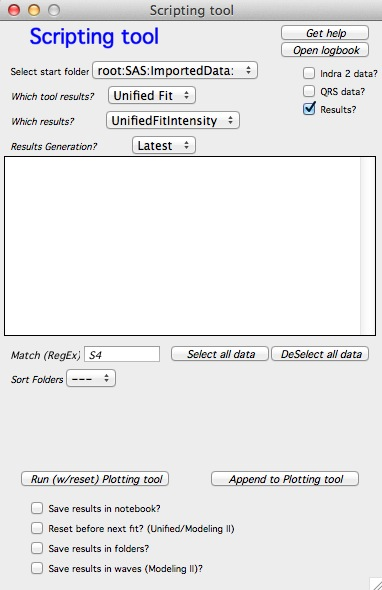
Select the starting folder and the folders to process. Select the data type.
When “Results” is selected, only Plotting tool I is available. Configure which
tool results to use, the result type (e.g., volume or number size distribution),
and the generation number (each “Save” click creates a new generation:
_1, _2, …). “Latest” selects the highest generation number found.
The processing order runs top to bottom in the list. Use the “Sort Folders” popup to control the order.
Buttons at the top:
“Get help” — opens a short help panel.
“Open logbook” — opens the scripting logbook (containing graphs and results) if it exists, or the standard internal logbook otherwise.
Select options
Save results in notebook — creates a notebook with a graph and results summary for each dataset.
Reset before next run — valid for Unified Fit. Resets to the test-case values before each fit rather than using the previous result as the starting point. Useful when changes between datasets are non-progressive.
Save results in folders — copies the usual result waves to the original data folders for later plotting or inspection.
Note
At least one of “Save results in notebook” or “Save results in folders” must be selected, otherwise the tool runs but produces no output.
Running the tool
Configure and test on a representative case (including extreme cases in the dataset). Verify that all fitting parameters, error weighting, background values, and Q ranges are correct. When ready, click “Run …. on selected data”.