Anisotropy Analysis — HOP
This tool analyzes the anisotropy of an oriented scattering peak using the Hermans orientational parameter (HOP) from Nika-generated intensity versus azimuthal angle data, according to formula 8 in:
P. C. van der Heijden, L. Rubatat, O. Diat, Macromolecules 2004, 37, 5327. https://pubs.acs.org/doi/10.1021/ma035642w
See also: L. E. Alexander, R. J. Roe, et al.
The tool accepts angular dependence of scattered intensity at a specific Q
value. The simplest way to generate suitable input data is to use Nika’s
Line profile tool to compute the intensity profile
along a circle at the Q value of interest, yielding intensity as a function of
azimuthal angle. Nika stores these data as triplets of waves named
az_Dataname, r_Dataname, and s_Dataname, where az_Dataname
contains the azimuthal angle in degrees.
Note
Proper calibration and background subtraction are essential before using this tool; otherwise the results will be incorrect.
Main GUI
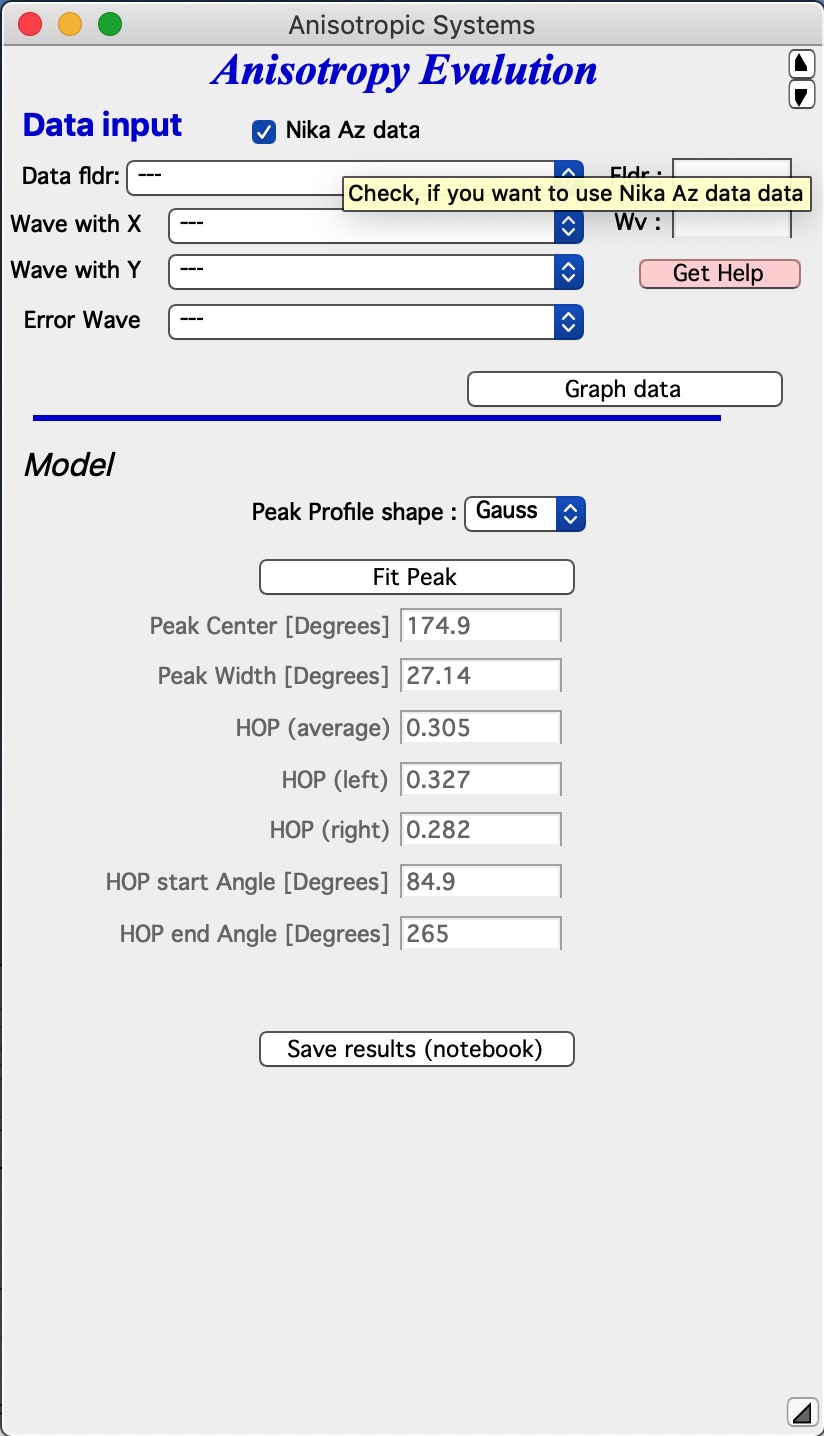
The top section contains standard data selection tools.
Data can be selected using the standard Irena selection system. When the
“Nika Az data” checkbox is checked, Nika-generated az_dataName and
r_dataName pairs are used (uncertainty wave is optional). When unchecked,
arbitrarily named data can be selected. The azimuthal angle wave must be in
degrees.
Select data and click “Graph data” to generate the graph:
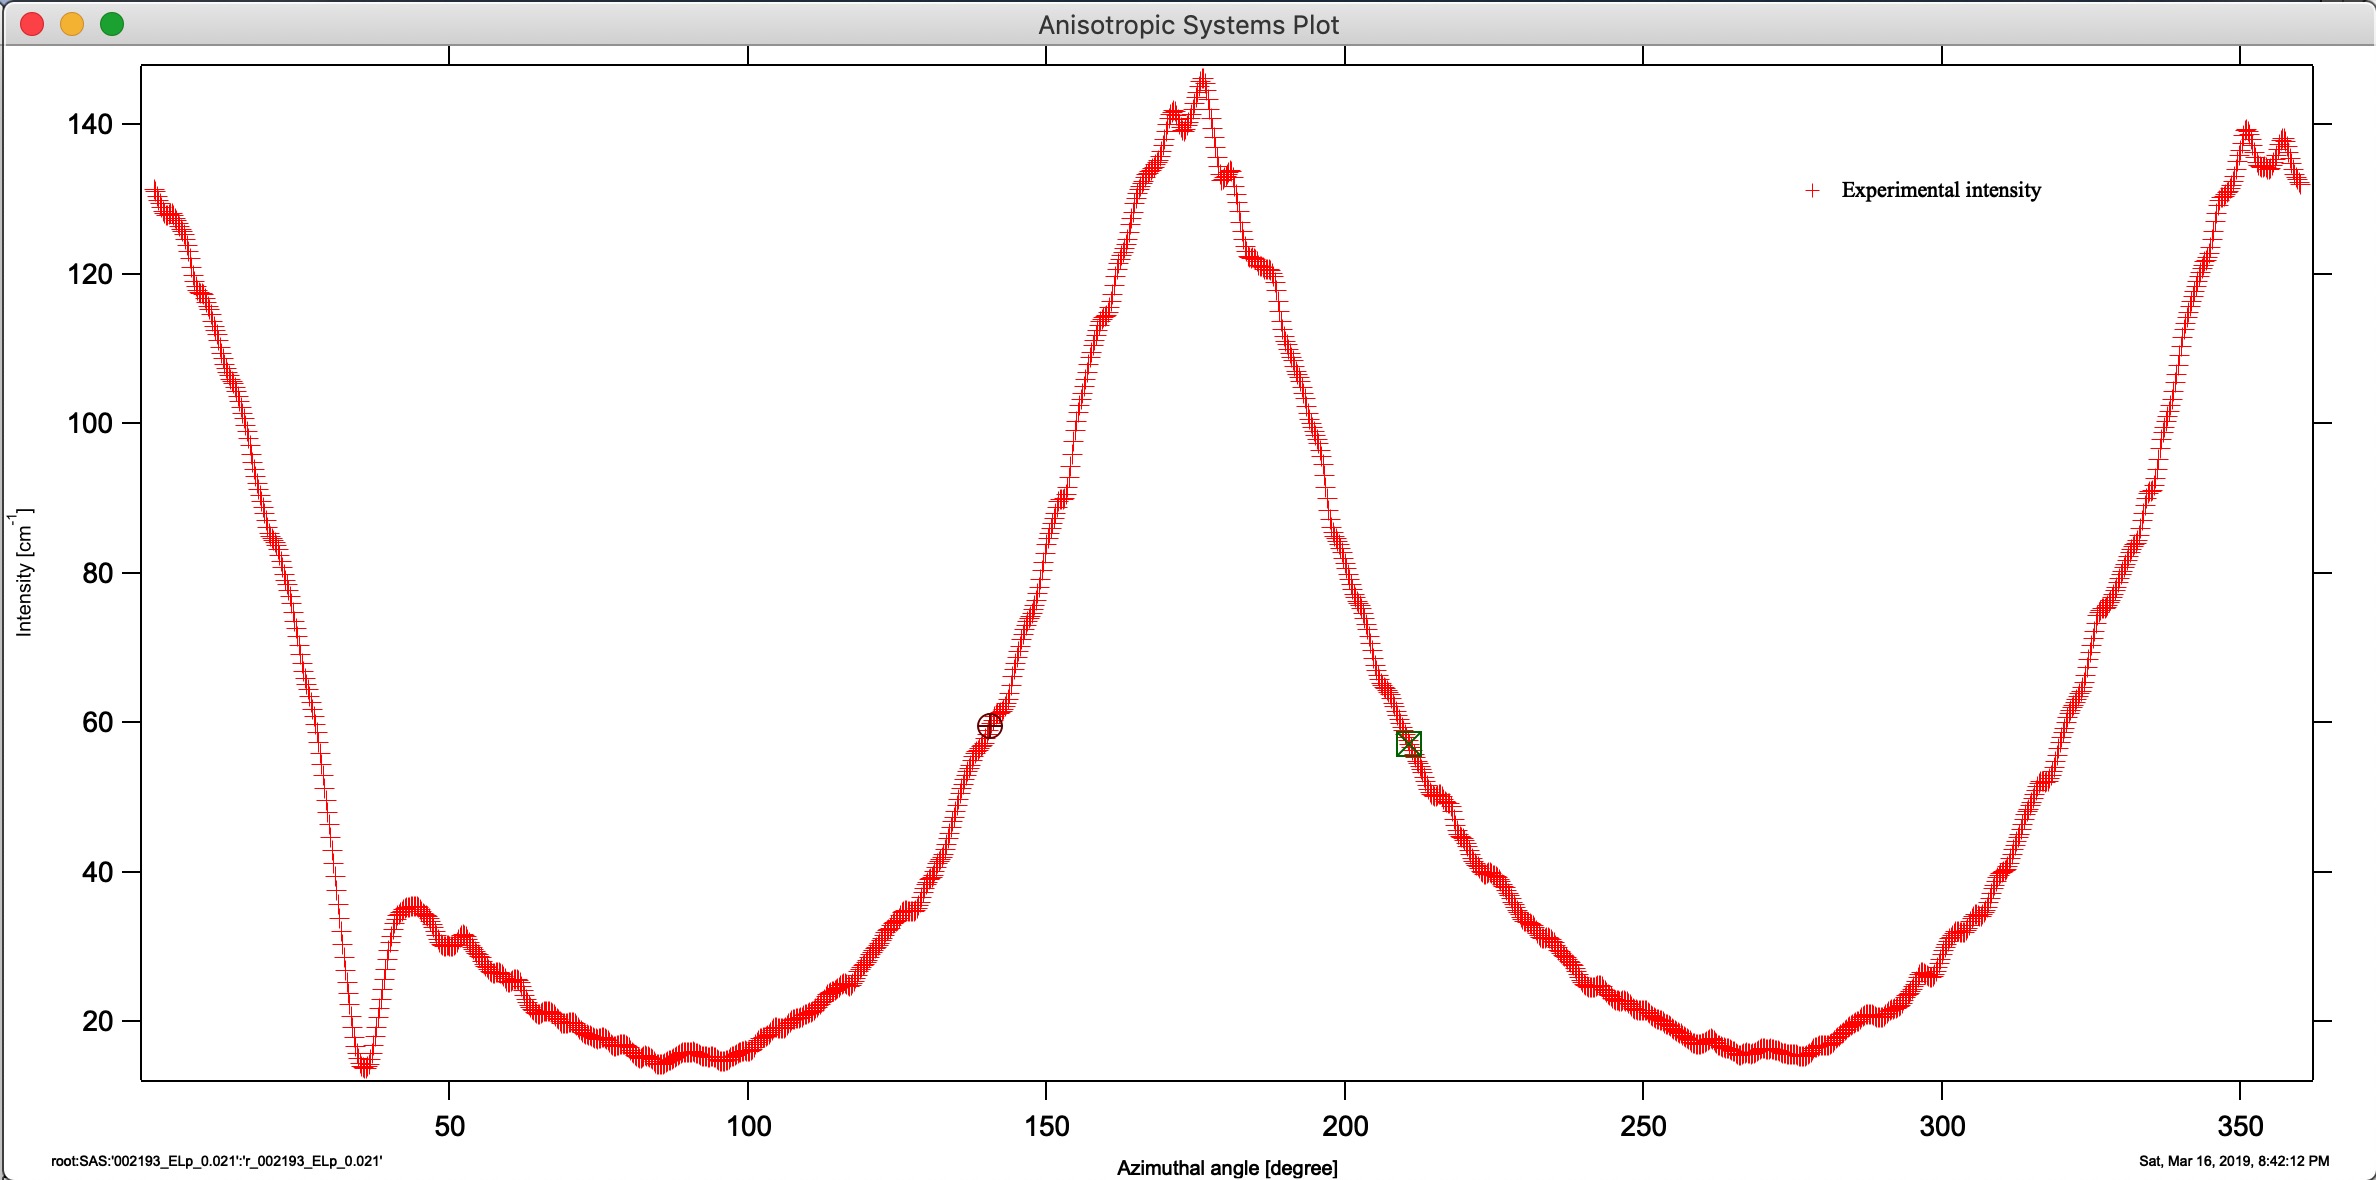
Set cursors to bracket the peak region — place each cursor below the half- maximum point on each side of the peak. The peak maximum must not fall exactly at 0° or 360°. The code internally extends the data to either side as needed, so the peak can be close to 0° or 360°, but enough of the peak must be visible for the position fit to succeed.
Select the peak profile shape (Gaussian or Lorentzian) and click “Fit Peak”. The complete analysis runs and fills the results table:
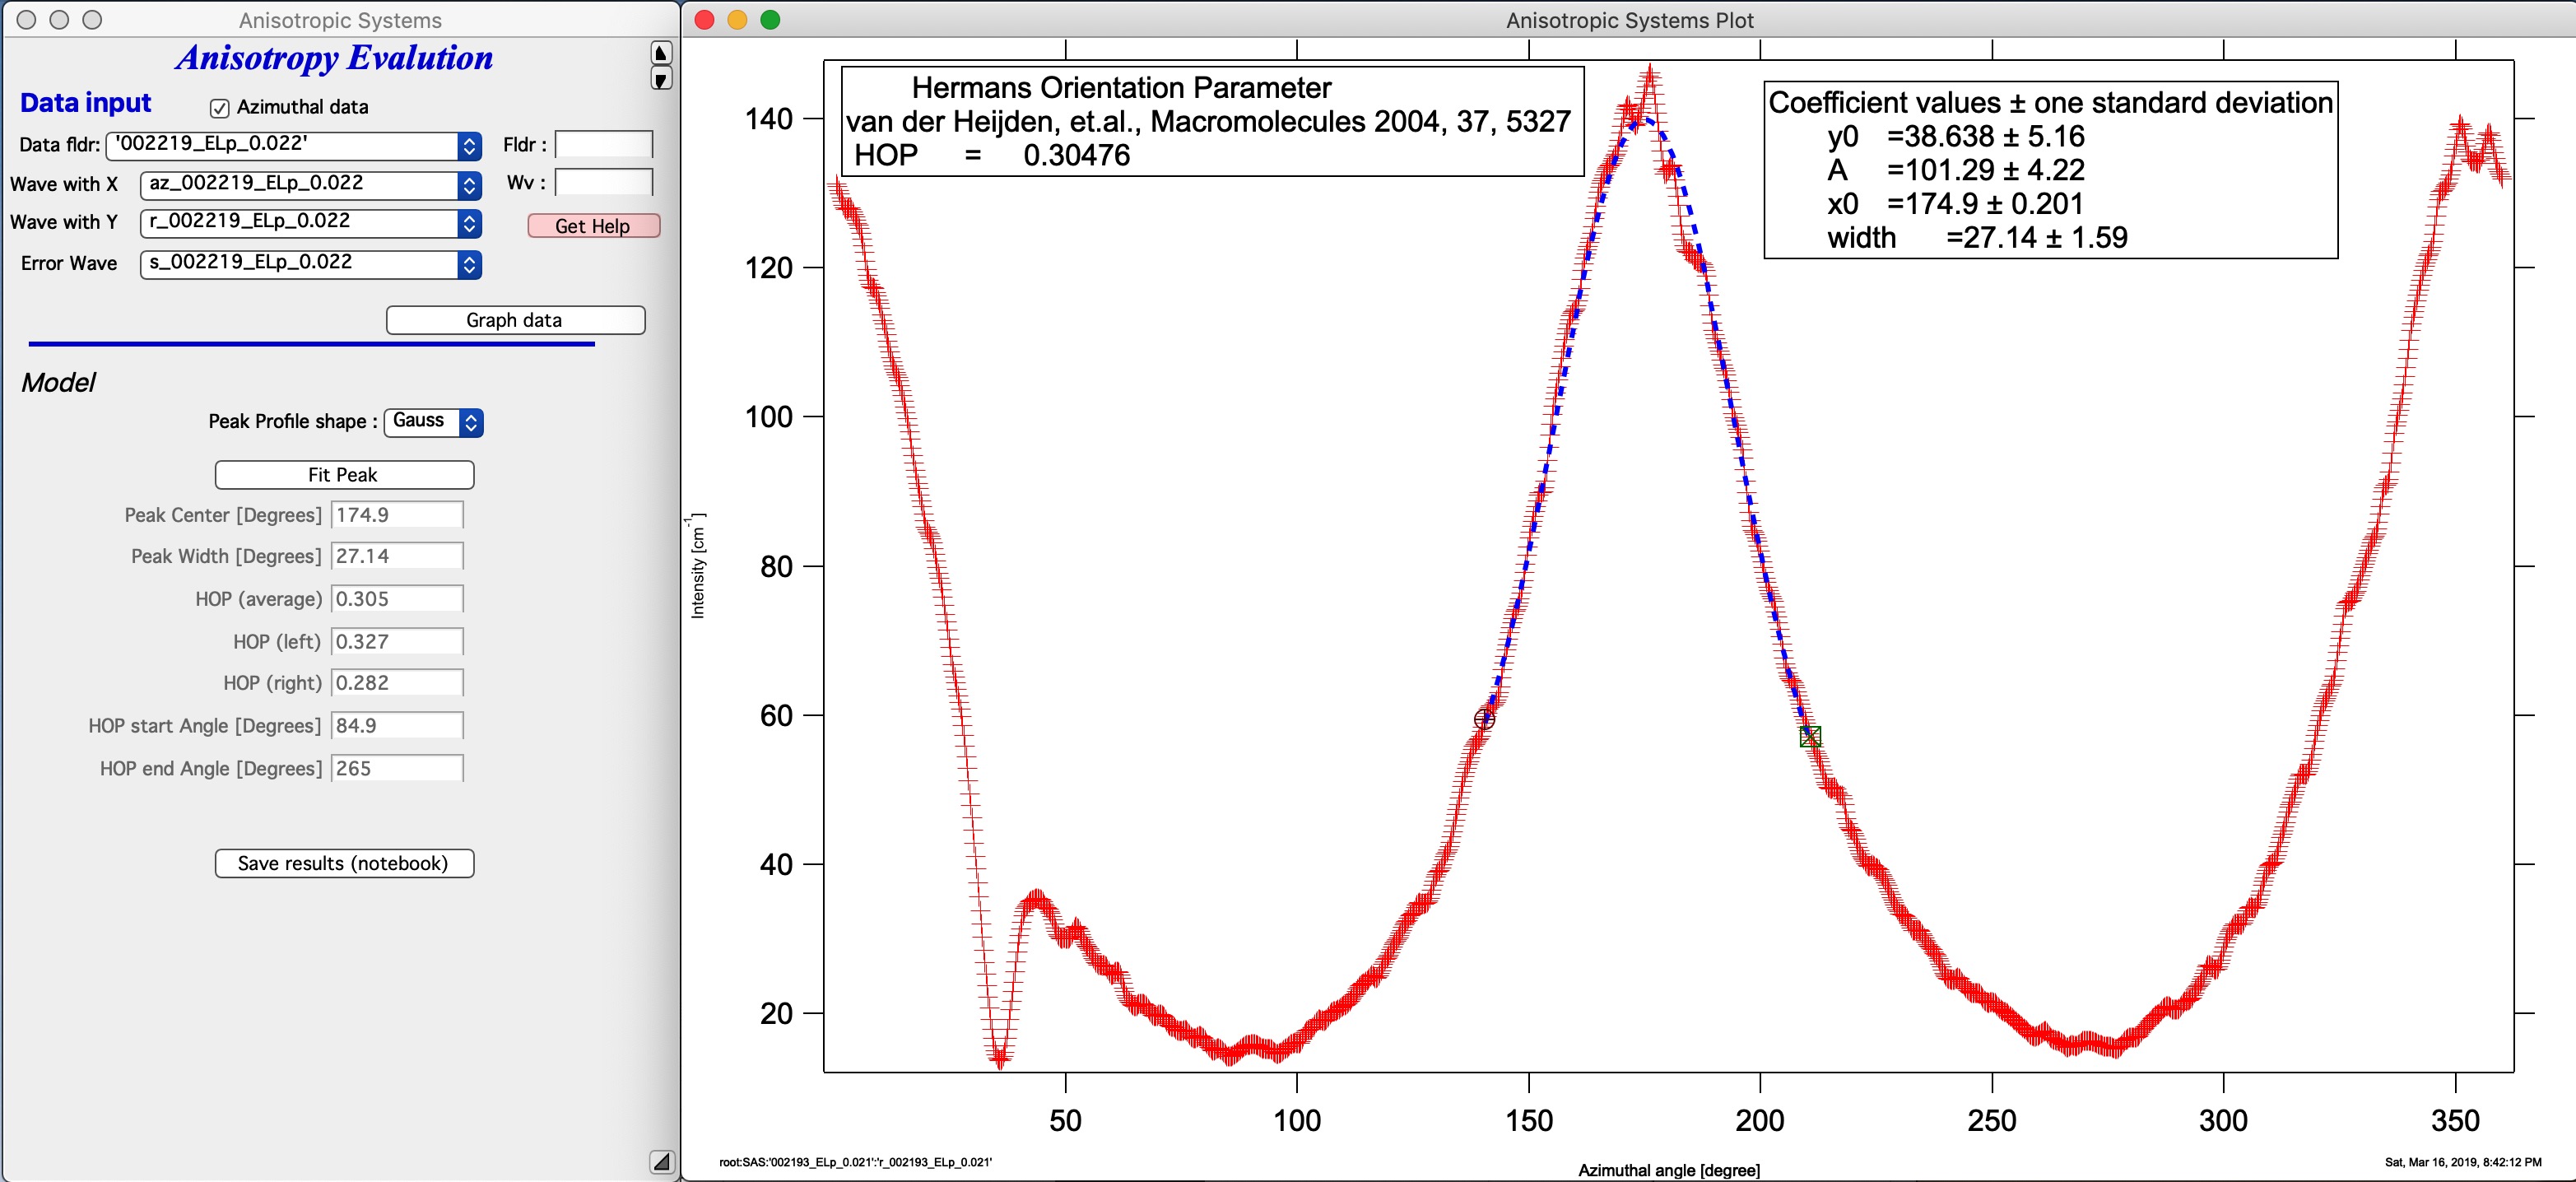
Results appear in both the table and the graph.
“Save results (notebook)” saves the results and graph to the Irena Results notebook, which can be exported as RTF for use in any word processor.
This tool cannot currently be scripted. Additional analysis options can be added on request — contact the developer with your requirements.