Important Information
All size-related parameters use Ångströms (10-10 m) or Q vectors in Å-1. Scattering contrast, number distributions, and volume-related quantities use centimeters (10-2 m).
Output sizes are usually in particle diameters. Modeling II uses radii by default (diameters are optional). Always read the graph legend or panel labels to confirm units, as they are not always the same across tools.
Loading the macros
Start Igor Pro.
In the Macros menu, select “Load Irena SAS macros”. Irena is loaded and compiled — compilation may take a moment. A new “SAS” menu appears; all Irena tools are accessed from there.
Unload the macros
To send an Igor experiment to someone who may not have Irena installed, remove Irena from the experiment first. Select “Remove Irena package” (last item in the last SAS submenu). This unloads the macros and restores the “Load Irena SAS macros” item to the Macros menu.
Data naming conventions
Data in Irena are stored as Igor waves (arrays). Typical SAXS or WAXS data have an x-axis (Q vector), y-axis (intensity), and optional uncertainty and Q-resolution waves. These are input data for Irena, typically produced by Nika or Indra, or imported using the Data Import tools.
In addition, most Irena tools generate output data (e.g., size distributions, Unified Fit model curves). These are Irena results.
Irena uses a strict “one folder = one sample” structure. Within the Igor experiment (viewed in Data → Data Browser), each folder represents one sample. Only one dataset per folder. When Irena saves results, it writes them to the folder from which the input data came. If multiple datasets share a folder, it becomes impossible to determine which results correspond to which input.
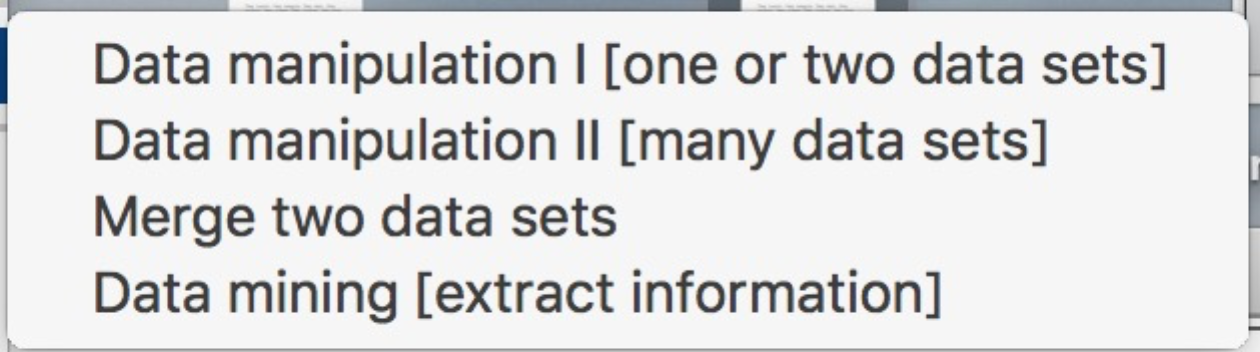
Data manipulation tools that create new datasets (e.g., merged data) create new folders automatically.
Data naming conventions — QRS
Default naming convention for SAXS/WAXS data stored in the Igor experiment
(typically under root:SAS:).
X-axis waves:
q_NameOfSample — Q vector in Å-1
t_NameOfSample — 2θ in degrees (when output is relative to 2θ)
d_NameOfSample — d-spacing in Å (when output is relative to d)
Y-axis wave:
r_NameOfSample — intensity (in cm-1 when calibrated; thickness is
converted to cm internally)
Error wave:
s_NameOfSample — uncertainty in intensity
Other:
w_NameOfSample — width of each Q, d, or 2θ bin
Data naming conventions — QIS
NIST modification of the QRS system. Irena treats QIS data transparently as QRS.
X-axis wave: NameOfSample_q — Q vector in Å-1
Y-axis wave: NameOfSample_i — intensity (in cm-1 when calibrated)
Error wave: NameOfSample_s — uncertainty in intensity
Data naming conventions — USAXS
Required to be in root:USAXS:. Irena uses the wave name prefixes to
automatically enable or disable slit smearing.
X-axis: SMR_Qvec (slit smeared) / DSM_Qvec (pinhole) — Q in Å-1
Y-axis: SMR_Int (slit smeared) / DSM_Int (pinhole) — intensity
Error: SMR_error (slit smeared) / DSM_error (pinhole)
Other: SMR_dQ (slit smeared) / DSM_dQ (pinhole) — Q-bin width
Slit smeared (USAXS) data
Fitting slit-smeared data directly is a major Irena advantage. It is nearly always better to fit slit-smeared data with the slit smearing included in the model than to desmear the data and then fit. However, some tools have limitations:
Due to the slit smearing implementation, the high-Q end of the modeling range must exceed the slit length. The APS USAXS slit length is typically 0.02–0.03 Å-1, so the high-Q range must extend to at least 0.08 Å-1. Selecting data only up to 0.02 Å-1 is not supported.
This limitation has been addressed for Modeling, Unified Fit, and Size distribution by automatically extending the Q range with up to 100 additional points to 10× the slit length, computing the model over the extended range, then truncating back to the user-specified range. This is transparent to the user but increases computation time per model evaluation.
Per-point smeared data by Q resolution
Available from version 2.58 for Modeling only. See the Modeling Q resolution section for details.
Kill all Irena panels and graphs
This menu item closes all Irena-related windows (panels and graphs) at once.
Irena manual
In most cases, the “Help” button on any panel opens the Irena manual in a web browser at:
http://saxs-igorcodedocs.readthedocs.io/en/latest/index.html
PDF, ePub, and HTML archive versions are available for download there.
Irena YouTube channel
Tutorial videos are available at:
https://www.youtube.com/channel/UCDTzjGr3mAbRi3O4DJG7xHA/about
Open Form factor description
This option opens a PDF describing all form factors in the Irena distribution, including simplified code examples and graphs.
Check for updates
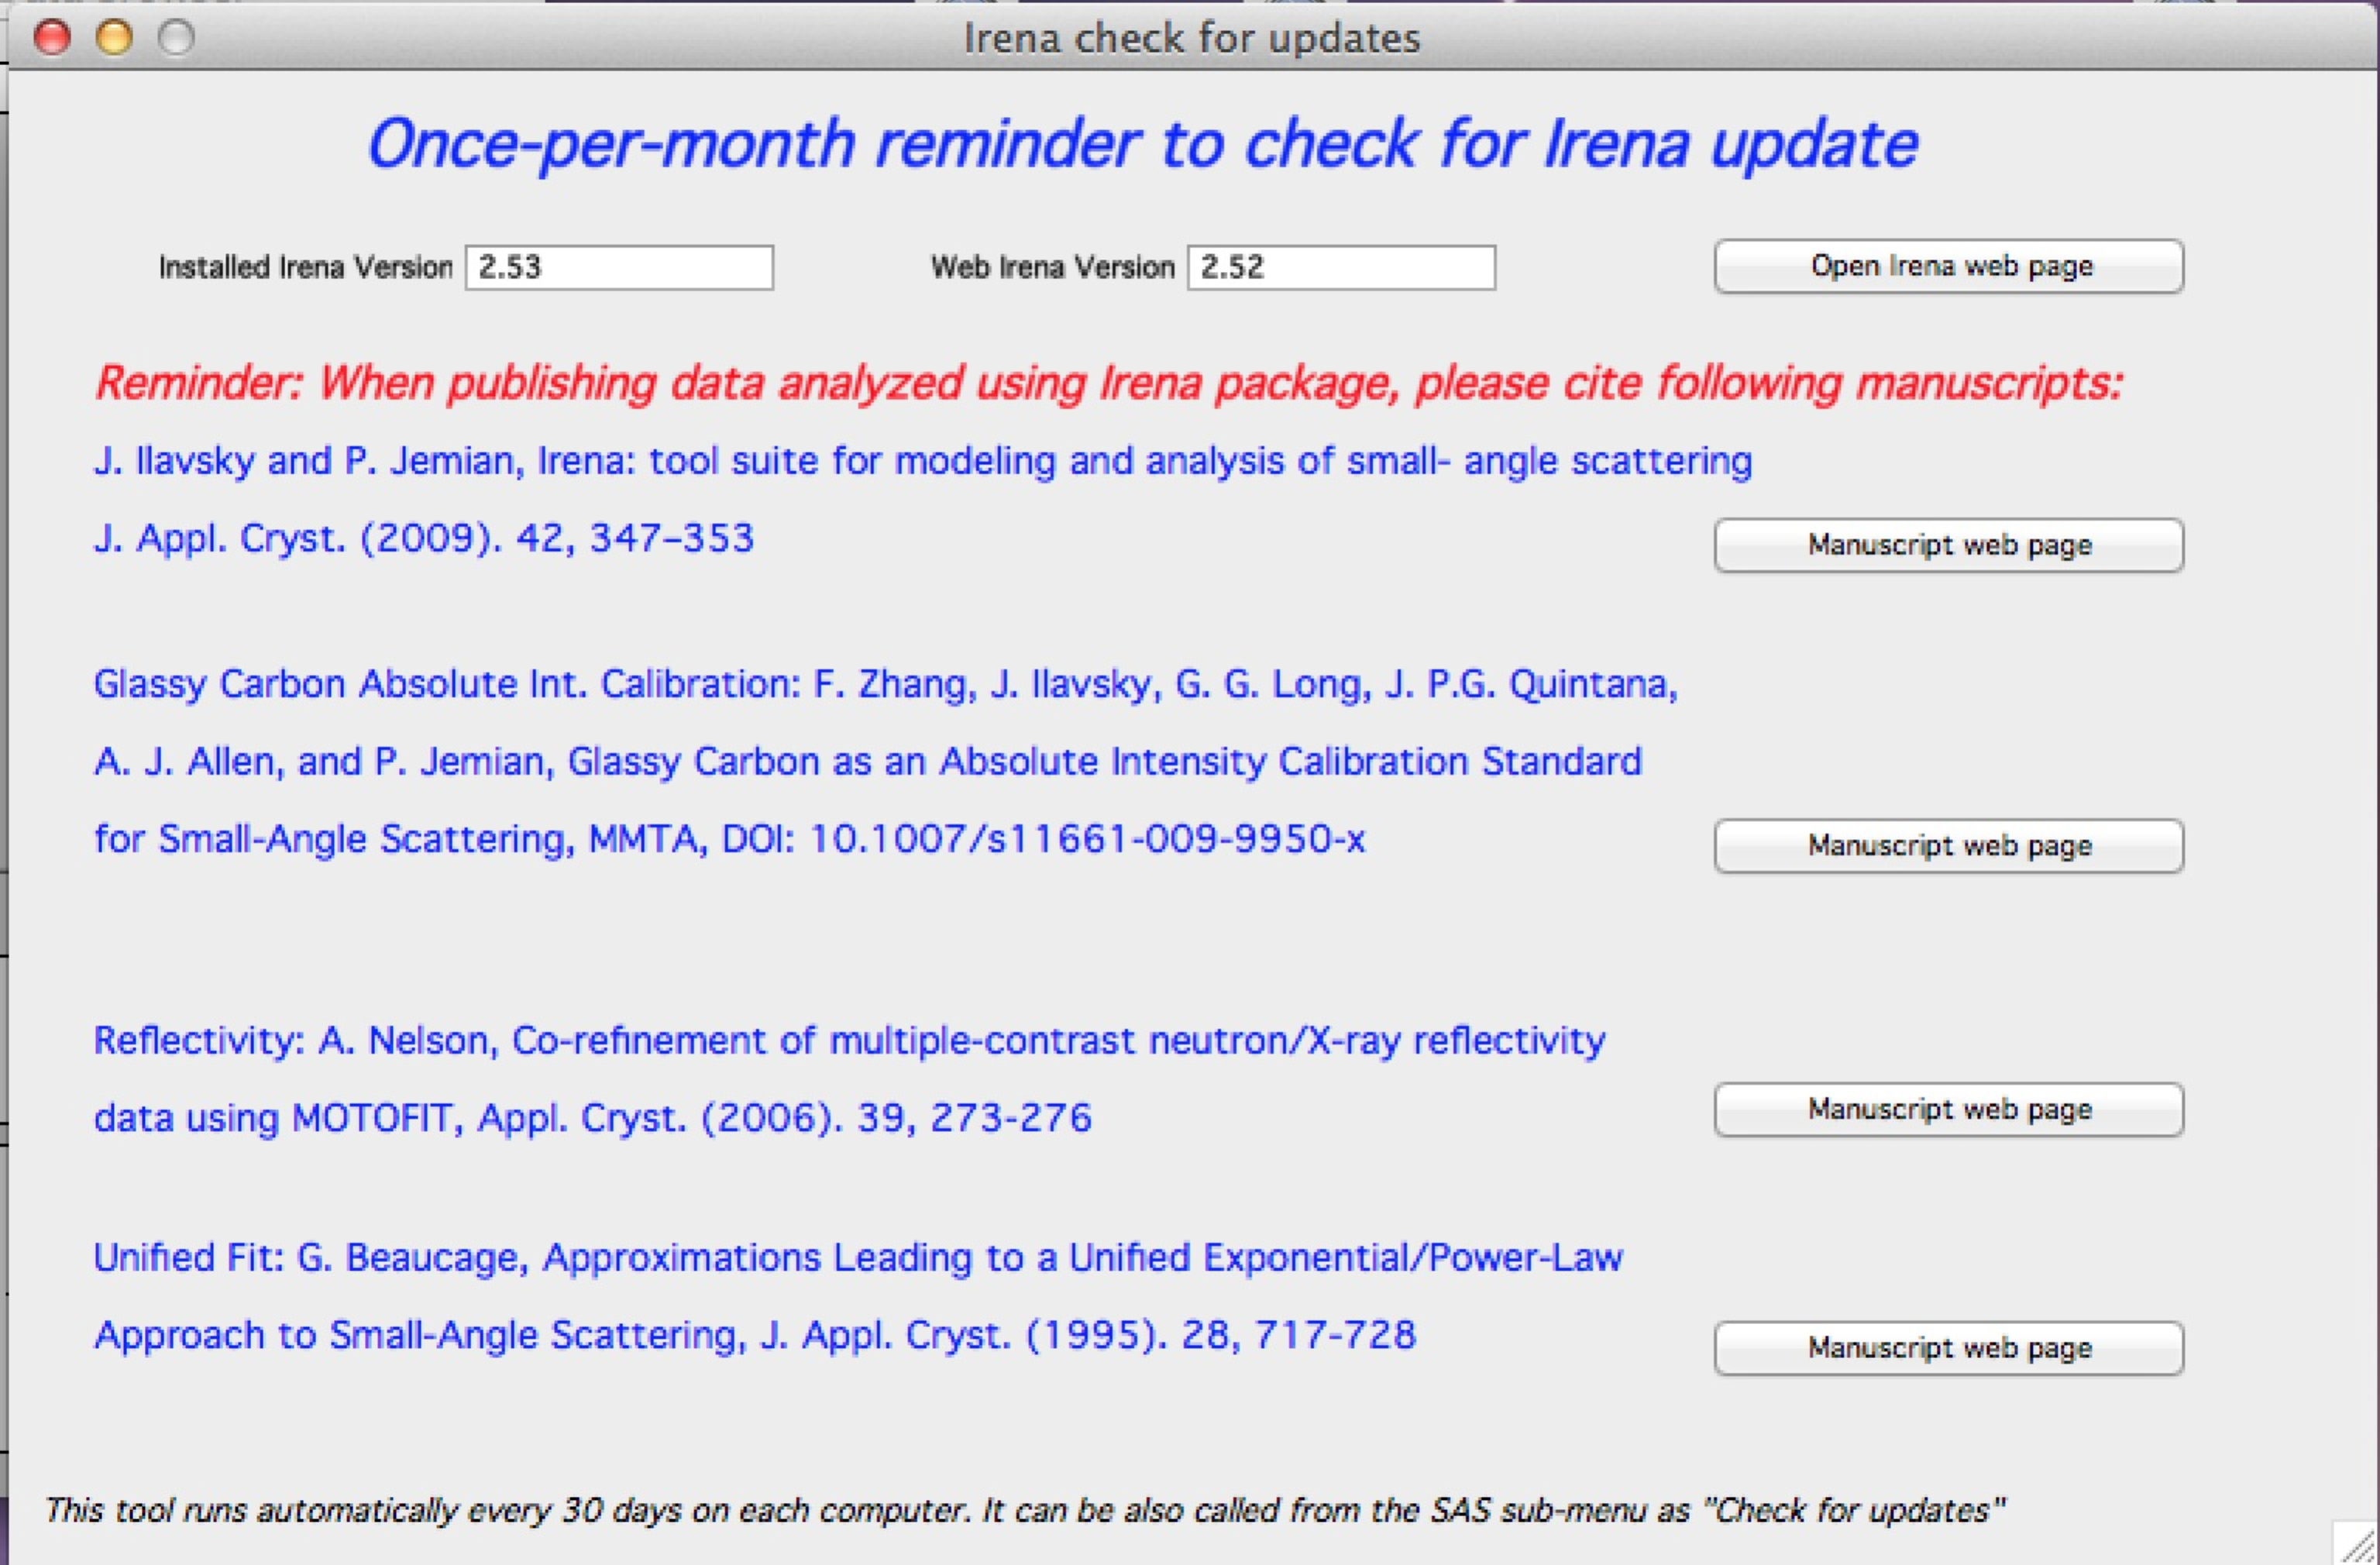
From version 2.52, Irena performs a monthly update check (every 30 days on any computer). It compares installed and available package versions and reminds users to cite relevant manuscripts. Access this panel at any time from SAS → Help, About, … → Check for updates. Buttons open the relevant web pages.
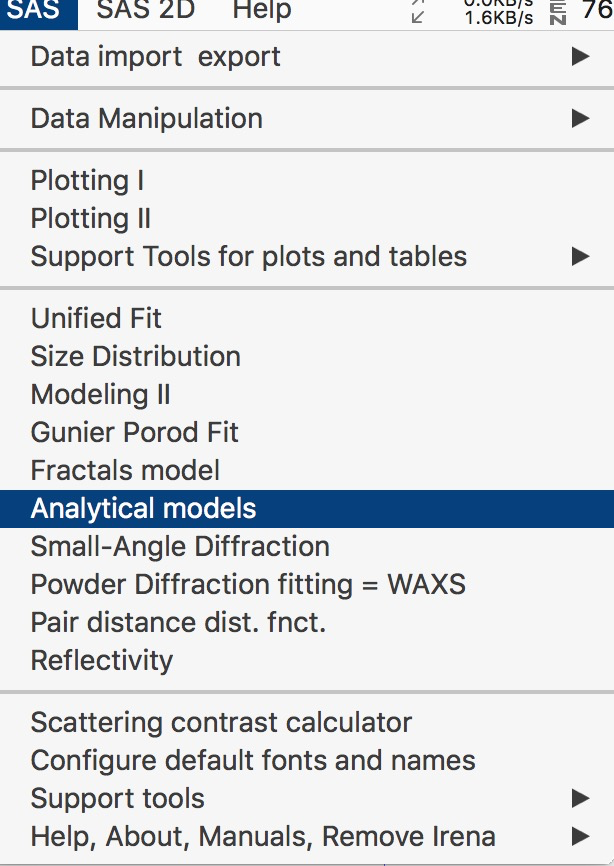
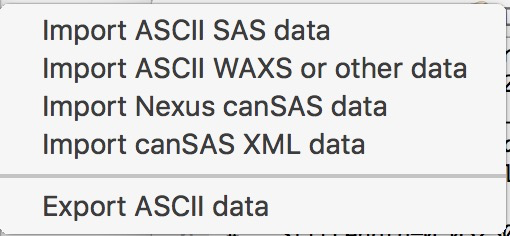
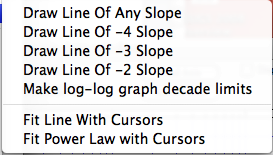
Location of items in SAS menu
The location of items in the SAS menu evolves across versions. Here is the current layout (version 2.62):
Submenus — Data Import and Export:
Support tools for plots:
Data Manipulation:
Support and older tools:
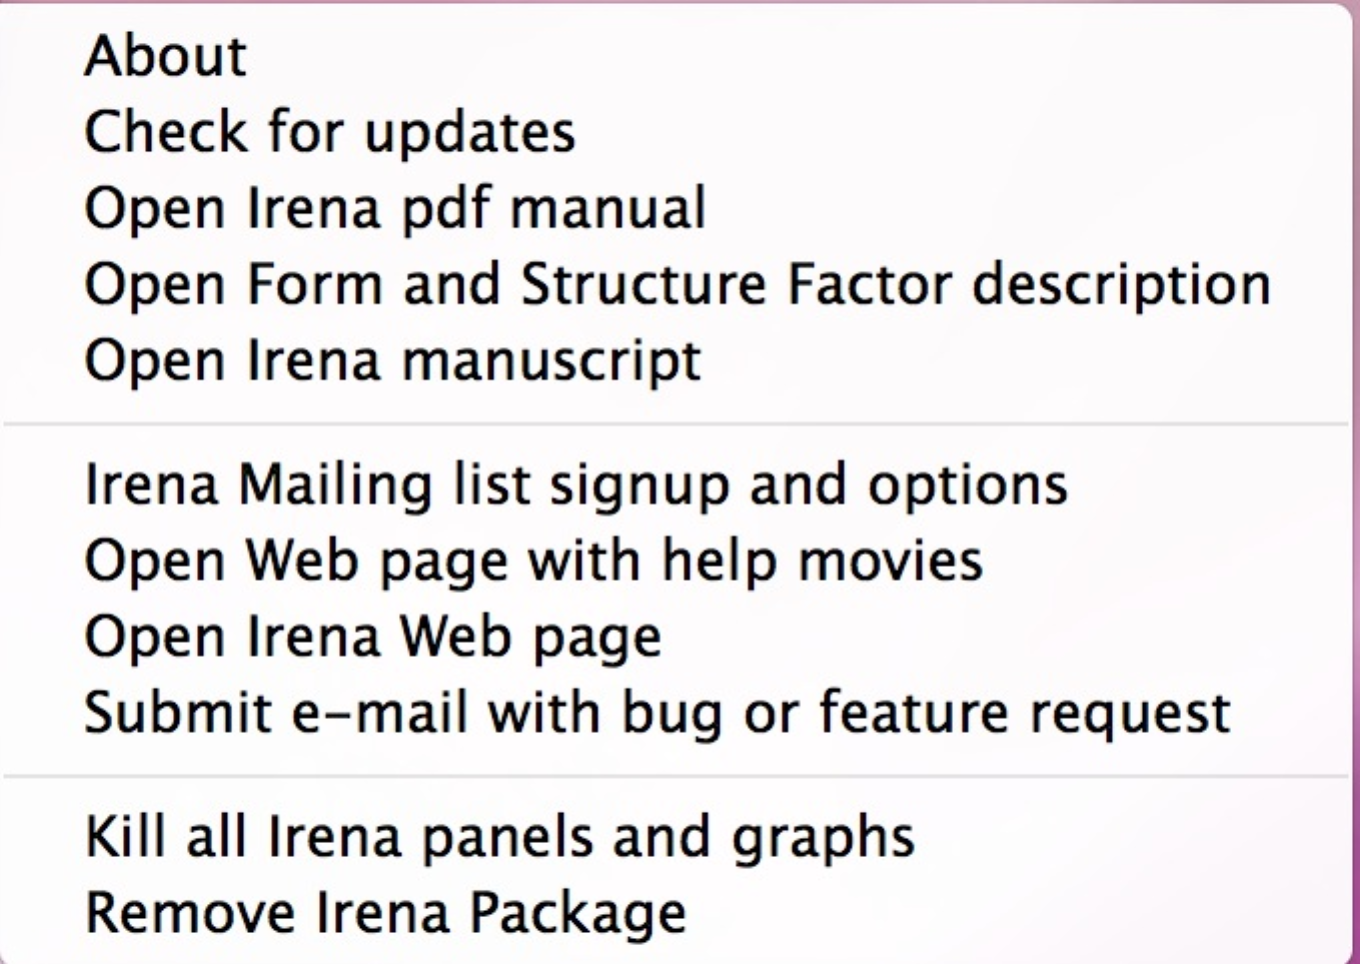
About, Manuals, Remove Irena, Help:
GUI controls and common controls
Manual, Manuscript, Mailing list, About…
The last menu item opens an “About” panel showing the current version and the Igor versions on which it has been tested.
From this panel, you can download and open the manual, access the manuscript, join the mailing list, and remove the Irena package from the experiment (useful when sending the file to someone without Irena, so they don’t see load errors).
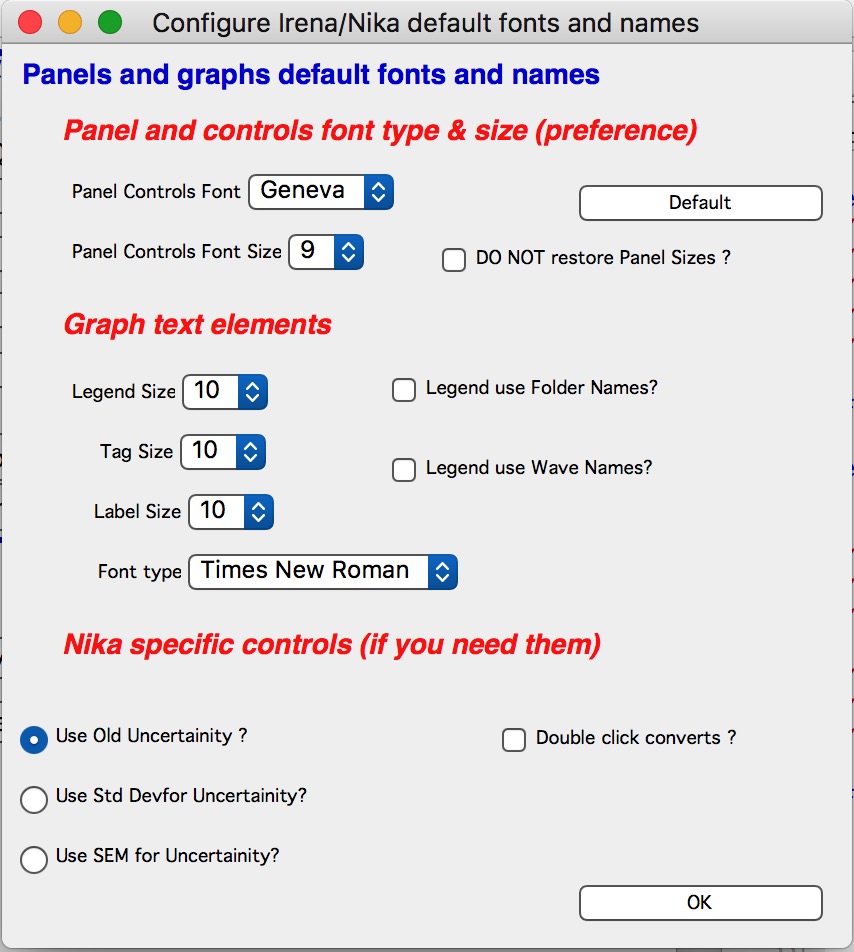
Configure figure default fonts and names
“Configure figure default fonts and names” in the SAS menu opens a panel with settings common to all tools, including font type and size and how legend names are handled.
Note
Panel controls are applied immediately to all existing panels. Graph controls are applied only to newly created graphs.
Do NOT restore Panel Sizes
Controls whether panels are restored to their last-used size and position when recreated or when an experiment is reopened. When enabled, every panel resize is recorded. On recreation, the panel returns to its saved size and position.
Note
Size and position are recorded only when the panel is resized, not when it is merely moved. To override this behavior temporarily, hold any modifier key (Alt, Cmd/Ctrl, Shift) while opening the panel.
Panels font and font sizes
These controls allow font customization on control panels to accommodate platform differences in default fonts and sizes. Settings are saved both on the local computer and within the Igor experiment.
When applied, preferences are stored in Igor’s user preferences folder and applied to the current experiment simultaneously. Opening the experiment on a different computer applies that computer’s stored preferences when “Configure GUI and Graph defaults” is run.
Panel fonts are platform-specific, so the same experiment may display differently on Mac and PC.
From version 2.62, these controls are shared between Irena and Nika, so not every setting shown applies to both packages.
Note
Not all controls follow these font settings — some buttons have fixed fonts that are not affected. Issues with panel appearance can be reported to the developer.
Defaults button: resets panel fonts to the platform defaults (Mac: Geneva size 9; PC: Tahoma size 12).
Graph controls
Global font settings are progressively being applied across all packages. This allows users to configure fonts for different screen sizes and resolutions on both Mac and Windows.
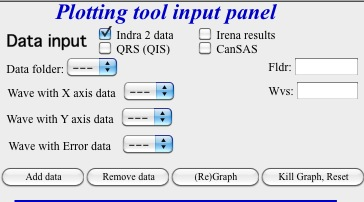
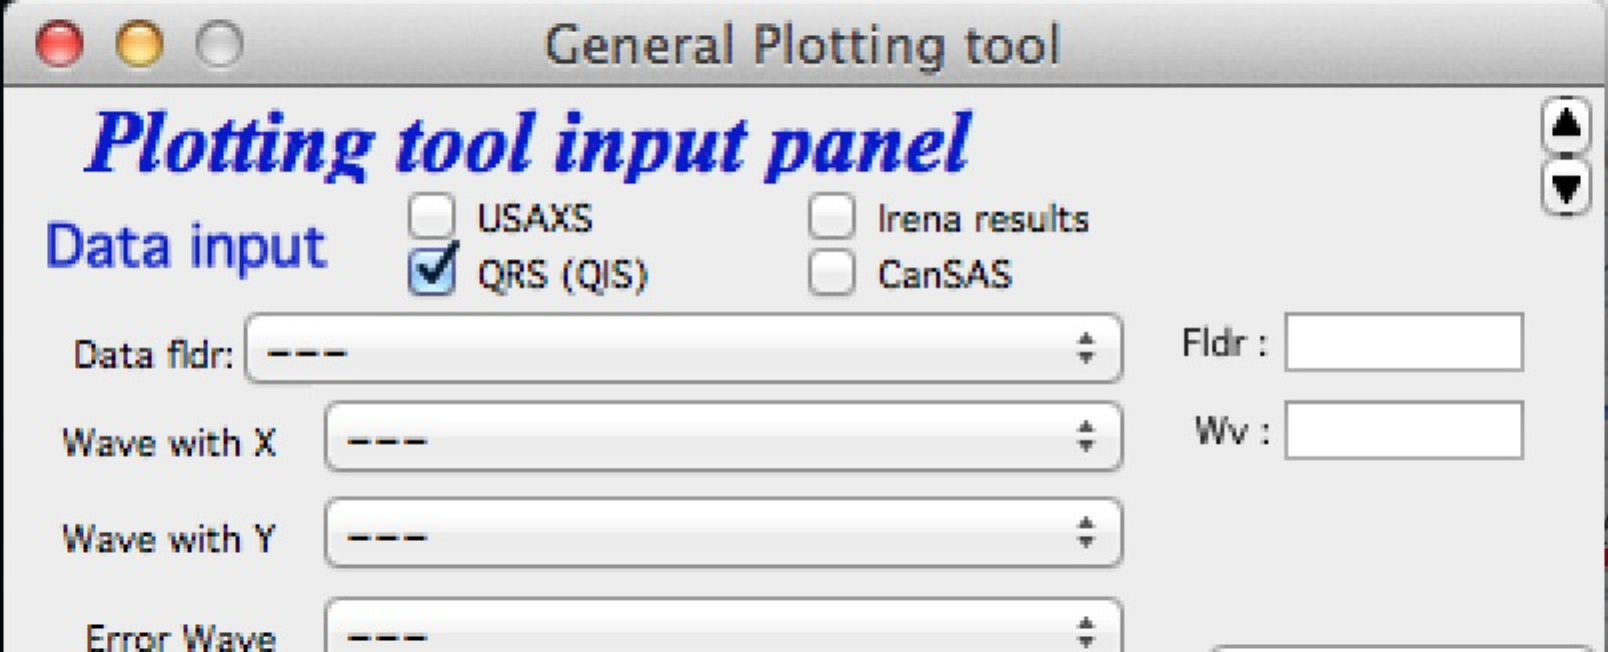
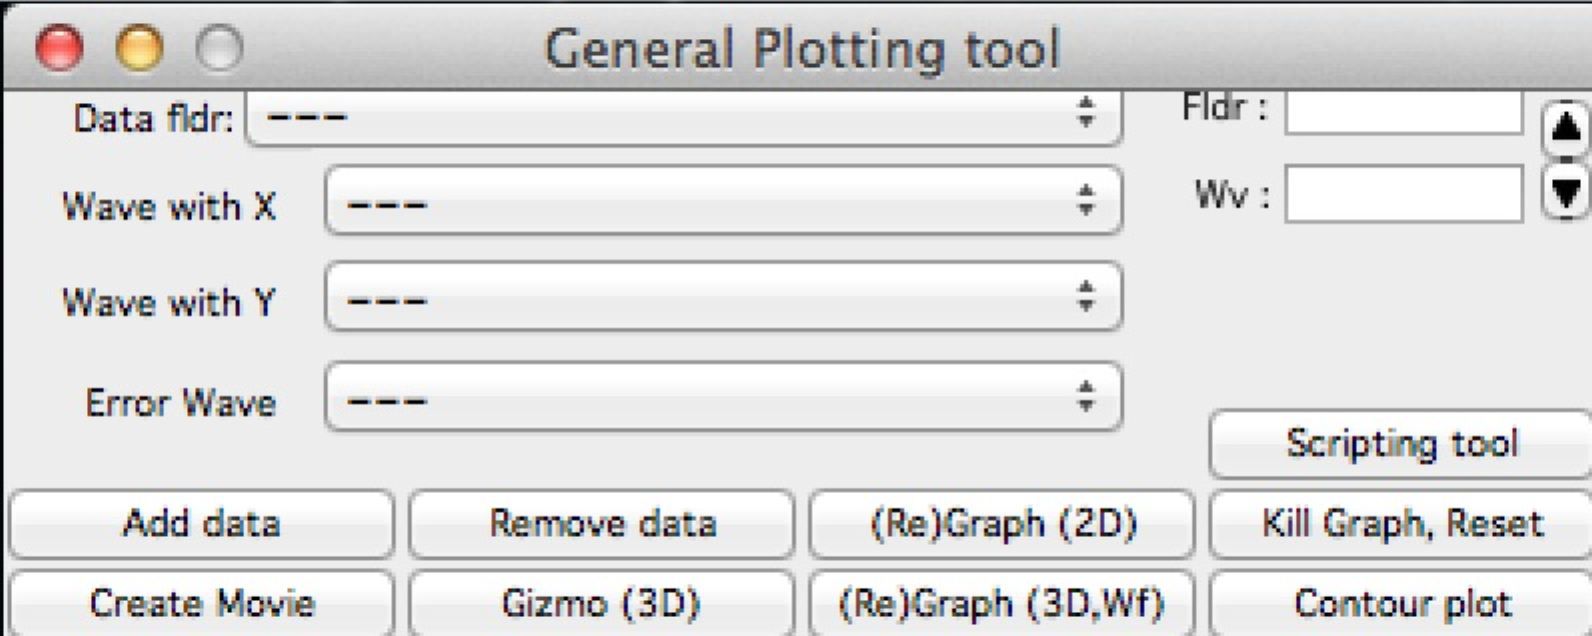
Data selection
The data selection section is common across most Irena panels. It provides checkboxes for data type, up to four pull-down menus for data folder and wave names (X, Y, error), and inputs for Qmin, Qmax, number of points, and log/lin binning (when applicable).
Data types:
Indra 2 data — USAXS data (DSM_Int, SMR_Int,
etc.) from the Indra package. Assumes data are in root:USAXS: or any
subfolder.
QRS data — q_name, r_name, s_name waves. Also
recognizes the NIST QIS system (name_q, name_i, name_s).
The w_name wave (dQ resolution) is propagated silently where present and
used for per-pixel smearing in Modeling II.
Model — no input data; the tool creates Q waves from user input and sets intensity and error to 0. Available only in tools that support model-only mode.
Irena results — results from any Irena tool. When more than one result is present in a folder, the appropriate one is selected by the tool.
User type — currently unused; reserved for future custom naming structures.
Nothing — all folders and all waves in the selected folder are presented without filtering.
Basic control logic:
When a data type is selected, the tool finds all folders containing at least one wave matching that type:
Indra 2 data: at least one of M_DSM_Int, DSM_Int, M_SMR_Int, SMR_Int triplets.
QRS data: triplets of waves starting with q, r, s with the same suffix. Note this is the most CPU-intensive type.
Irena results: any recognized Irena result wave. Contact the developer if a result type is missing.
These folders appear in the Data folder pull-down. Selecting a folder automatically fills the wave popups with the first valid matching set. If a different dataset is needed, change the X-axis wave selection; the tool attempts to fill the remaining popups accordingly.
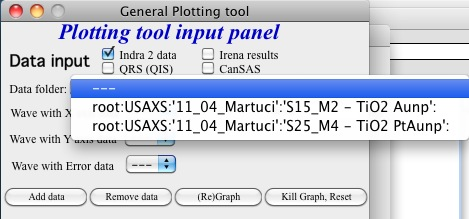
Folder/Wave name masking:
From version 2.53, wave and folder names may contain characters such as
(){}%#^$?\|&@. Two match fields (Fldr and Wvs) filter the pull-down menus
to show only names containing the specified string. If these fields are hidden
below other controls, select “—” in the nearby popup to access them.
In version 2.53 and later, these fields accept a simple string (not a regular
expression) — just enter the desired substring with no wildcards. For example,
entering test shows only names containing “test” anywhere.
For two required substrings in order: String1.*String2 (no spaces around
.*).
Match strings are tool-specific and not shared between panels.
Example — filtering to show only folders containing “Aunp”:
Default state (all folders shown):
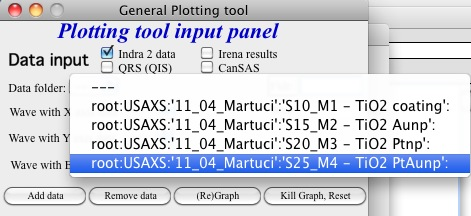
Setting the match string to “Aunp”:
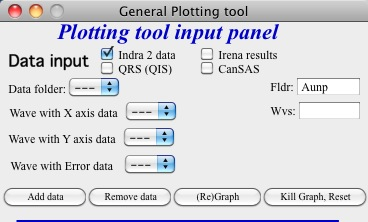
Result — only matching folders displayed:
To exclude folders containing a specific string, use the regular expression:
^((?!xyz).)*$ where xyz is the string to exclude.
MultiData selection
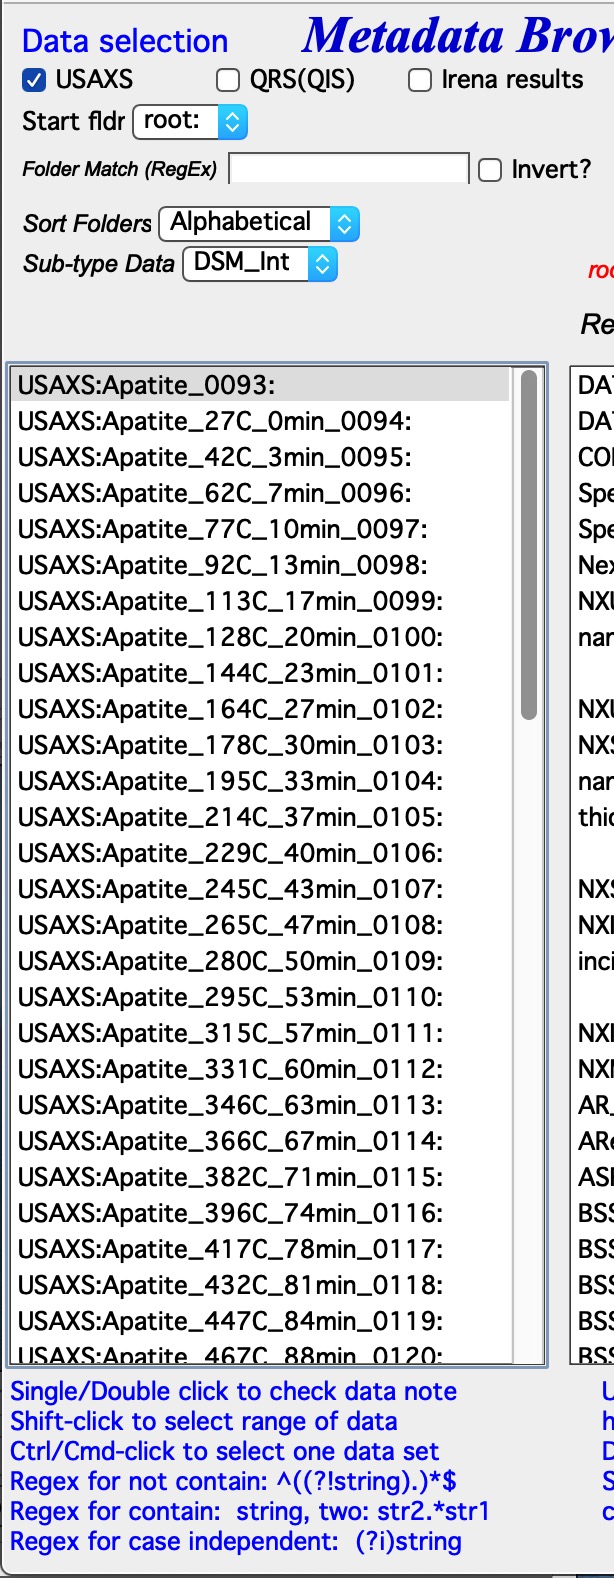
Data types recognized:
USAXS — data from the APS USAXS instrument.
QRS — default SAXS/WAXS naming. See QRS data type.
Irena results — fits, size distributions, PDDFs, diffraction peaks, etc.
Any — enter a regular expression defining which waves are X, Y, and (optionally) error. The first match is selected.
“Start Fldr.” — starting location for the folder search.
“Folder Match (RegEx)” — regular expression filter for folder names.
“Invert?” — inverts the filter.
“Sort Folders” — sorts the folder list by any of several criteria.
For Irena results, additional selections are needed:
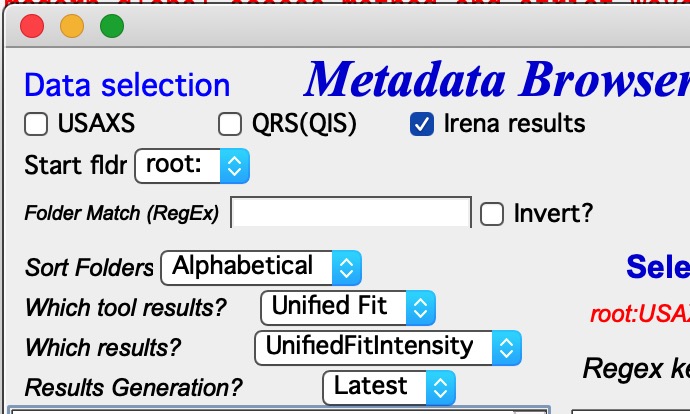
“Which tool results” — select the Irena tool (e.g., Unified Fit).
“Which results” — select the result type (e.g., UnifiedFitIntensity).
“Results generation” — select Latest, or a specific generation (_0 through _10).
For Any (no type selected):
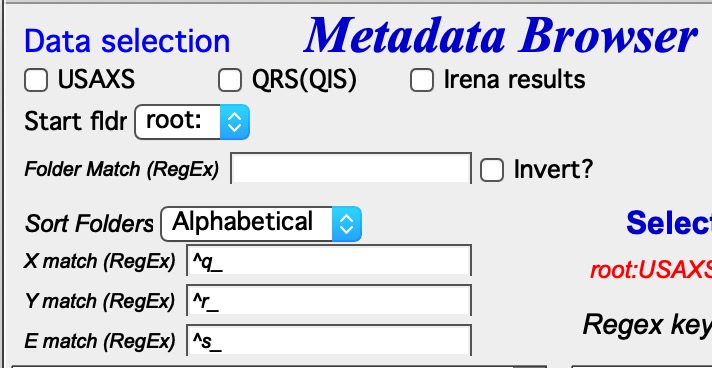
Enter regular expressions to match the X, Y, and error waves uniquely. This is flexible but requires knowledge of regular expressions.
Usage tips: Select data type checkboxes appropriately. Choose a specific starting folder to avoid listing thousands of datasets. Use Folder Match (RegEx) to show only relevant folders. Sort data in the order appropriate for your analysis (time, temperature, etc.).
Using Irena on small displays
Irena generates many windows, panels, graphs, and notebooks. A minimum display of 1100×900 pixels is required. A 1024×768 display is too small for productive work.
At startup, Irena checks the available display area. If it is below the minimum, a warning dialog appears and instructions are printed in the history area. Some tools may refuse to open if their panels would not fit. On Windows, reduce display scaling (“dpi”) or increase resolution; on Mac, increase resolution. To recheck after changes, use “Check Igor display size” from the SAS menu.
See also: GUI Controls Missing in Common Issues.
Most panel content can be scrolled vertically using the arrows in the top-right corner of each panel:
Content scrolled up to reach bottom controls:
On large displays, panels can be resized by dragging the lower-right corner:

Panels can be scaled up but not below their original size. Panel size and position are saved as preferences on the current computer. The saved size is applied when the panel is reopened, even across sessions. Size is capped at 50% of the display width and 90% of the display height. To reset a panel to its default size, hold any modifier key (Shift, Alt, or Cmd/Ctrl) while opening it.
To disable automatic size/position restoration, use the setting in “Configure defaults”.
Using Irena on high-resolution displays
Use of XOP
Igor Pro supports external C-code (XOP) libraries to accelerate computationally intensive operations. XOPs are bitness-specific (separate builds for Igor 32-bit and 64-bit) and must be placed in the appropriate Igor folder.
Currently supported optional XOPs:
By Andrew Nelson (http://motofit.sourceforge.net/wiki/index.php/Main_Page):
abeles.xop— reflectivity calculations (required for the Reflectivity tool)GenCurveFit.xop— genetic optimization (required for Genetic optimization)
Both provide 5–40× speedup over the Igor-only implementations. These XOPs do not carry version numbers; update them with each Irena release.
XML loader (also by Andrew Nelson) — required for loading canSAS XML file format. Available at: http://www.igorexchange.com/project/XMLutils
NIST form factor XOPs (from version 2.53) — provide additional form factors (Parallelepiped, Cylinder, Spheroid) and speed improvements. Maintained by NIST; obtain the versions distributed with the Irena package.
Genetic optimization
Genetic optimization is a global optimization method particularly useful when least-squares fitting may find a local rather than global minimum. Developed for reflectivity data by Andrew Nelson, who also wrote the Igor implementation.
This code uses a Monte Carlo search method. Parameter limits are critically important: the optimization samples the entire specified parameter space, so limits must be set to physically sensible ranges. Incorrect limit choices will produce meaningless results. Additionally, the model evaluation must not fail for any combination of parameters within the specified limits.
When genetic optimization is invoked, a dialog prompts the user to review and confirm all parameter limits before the search begins.