Data mining tool
This tool locates and tabulates various data values stored across folders within an Igor experiment. Data can be stored in variables, strings, wave notes, or as waves. Depending on the input type, results can be output to graphs or a notebook (for waves), or to a notebook or new waves (for strings, variables, and wave note data).
Note
This tool is functional but still being developed. Additional features will be added in future releases.
Use
The tool has some behaviors that differ from other Irena panels.
In the top section, select the data type to search and an example folder that contains the data types you want to mine. You must be able to find at least one folder with the data of interest.
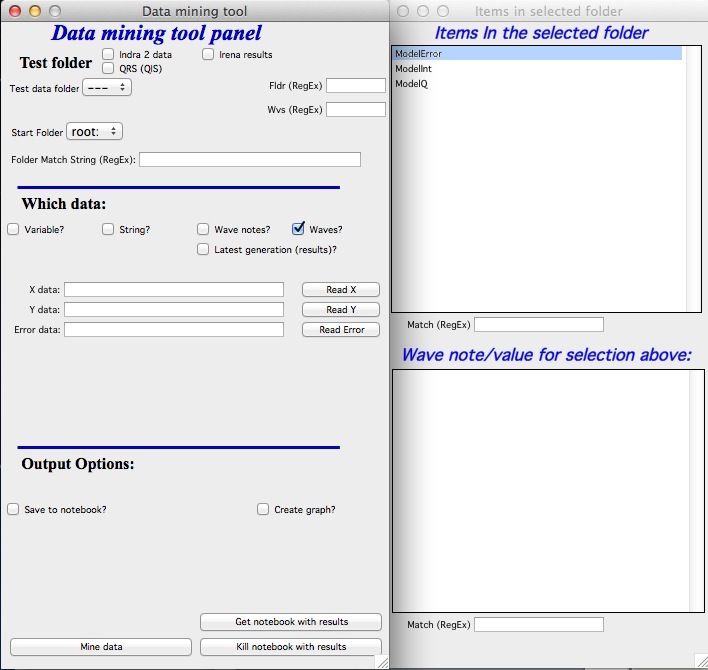
When you select such a folder, a new panel appears listing the specific items in that folder. The top list shows waves, strings, or variables as appropriate; the bottom shows the wave note (for waves) or the value (for strings or variables).
Mining waves
Enter or select wave names — one, two, or three — in the provided fields. To
select, highlight a wave in the panel and click “Read X” (or Y or Error). The
* wildcard is supported. Output options: print to a notebook (listing which
folders do or do not contain these waves) or plot the waves into a graph (X vs Y)
with controls for colors and axis scaling.
Mining strings, variables, and wave notes
Select a string or variable name in the right panel list and click “add to list”. To select wave note content, select both the wave and the desired wave note item, then click “add to list”. To remove items, use “Clear” to clear the entire list.
Output can be sent to a notebook (can become large quickly) or to new waves. Create a new folder for the output waves before searching. After the search, output waves are created, converted to numeric waves where possible, and displayed in a new table.