Analyze results
This tool analyzes results from other Irena tools where that functionality would not fit within those tools’ panels. Currently it supports results from the Size Distribution tool. It is available from SAXS → Support tools and replaces the older “Evaluate Size distributions” tool (still available in “Old stuff” with the same functionality).
Implemented models:
Volume distribution
Number distribution
Selecting data
Familiarity with the data selection tools simplifies use of this panel. In the Data selection area, define the data to analyze. Full details are available in Multi Data selection. The tool accepts three data types: USAXS, QRS (SAXS or WAXS), and Irena results. SAXS/WAXS data that do not come from the APS USAXS instrument use the QRS naming system; use USAXS only for APS USAXS data. For Irena results, the two applicable types are Volume and Number size distribution outputs.
Select Start fldr (e.g., root:SAXS:) and a data type using Folder Match
(e.g., sub).
Add data by double-clicking in the folder list. Data are added to the top graph as log-Intensity vs log-Q. For some models (Guinier, Porod, etc.), the lower graph shows a linearization plot.
Saving results
Results can be saved in three ways using the checkboxes on the panel:
Notebook — results are printed to a notebook, opened with the “Get Notebook With Results” button.
Waves — waves containing result values and a text wave with folder names are created in an Igor folder (
root:NameDependingOnMethod). Use “Get Table With results” to display them. These waves can also be plotted manually.Data folder — fitted intensity-Q waves are saved in the source data folder, with fit parameters in the wave note. These data can be plotted with Irena plotting tools and the wave notes inspected later using the Metadata Browser.
Run as sequence
Select multiple datasets in the listbox, choose the analysis method, set the Q range, configure result storage, and click “Evaluate sequence” to process all selected datasets in order (top to bottom as listed). Ordering the data meaningfully (by time, temperature, etc.) produces result tables in a correspondingly useful order.
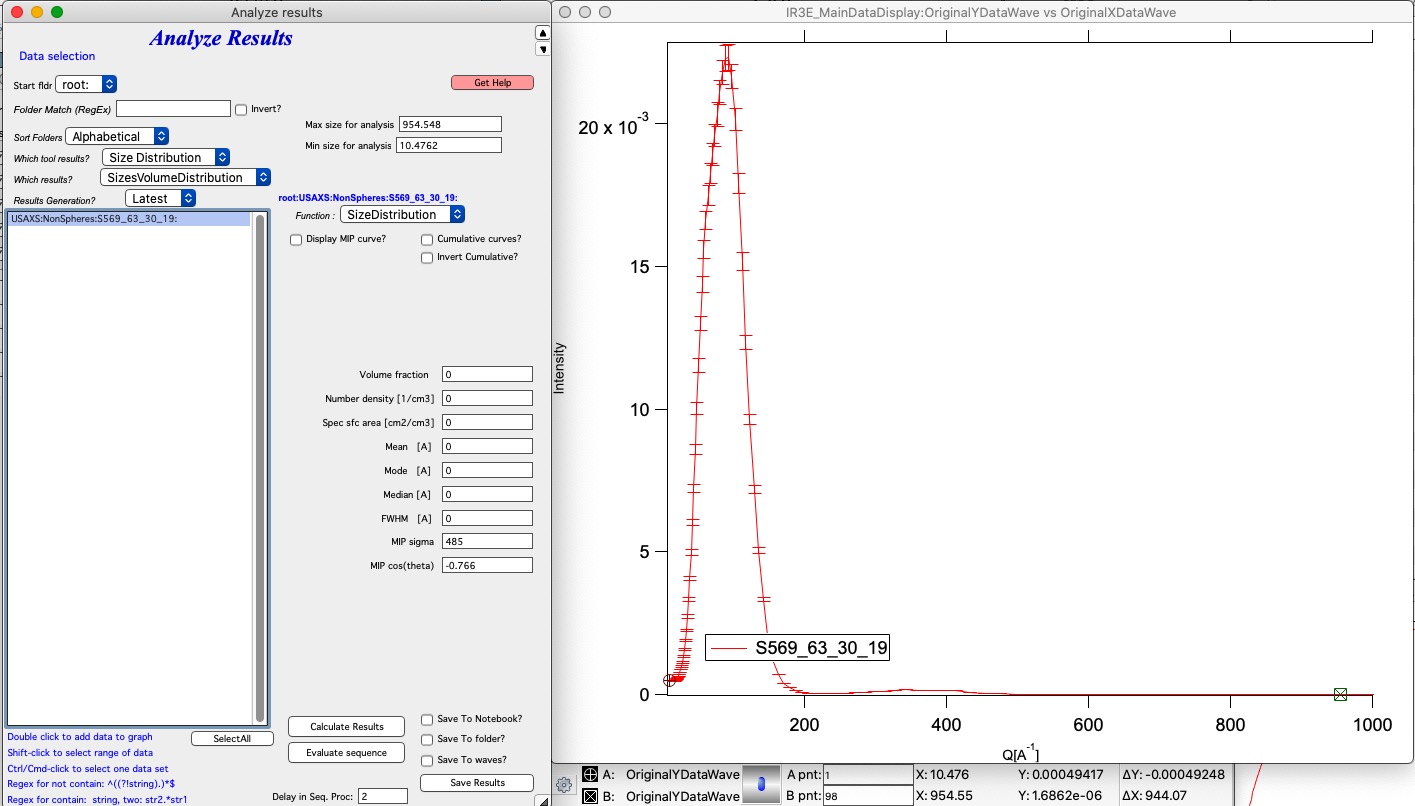
Using the tool
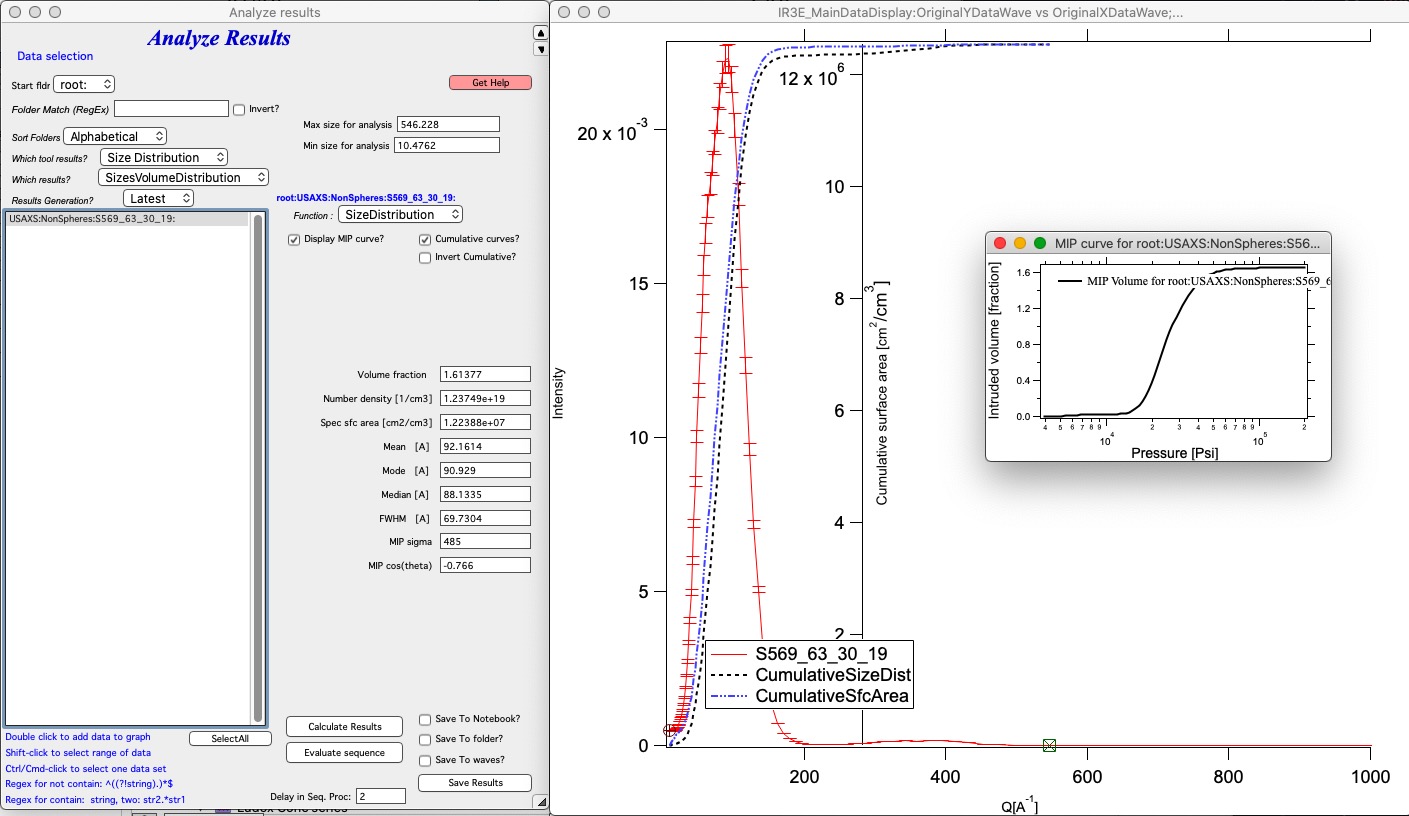
Add data to the graph (double-click), set cursors to the analysis range, check whether Mercury Intrusion Porosimetry output is needed, and click “Calculate Results”. Save results as needed. For multiple datasets, configure and test settings on one representative dataset, then select the range in the listbox and use “Evaluate sequence” to process all of them.