Metadata Browser
Irena uses wave notes in Igor Pro to store metadata for all data operations. When data are imported, Irena records the source file, location, processing history, and any modifications. Each subsequent processing step in Irena adds further metadata to the wave note. The result is a large accumulation of information that is difficult to read directly.
Metadata are formatted in the wave notes as Keyword=Value; pairs. This
consistent format enables the Metadata Browser to provide a structured
interface for searching and extracting specific metadata values.
Igor’s DataBrowser provides basic access to wave notes: select a wave, enable the “info” checkbox, and the wave note is displayed.
Keyword conventions:
Import step: keywords related to import date, source filename, etc.
Instrument metadata: keywords from the data container (header, NeXus metadata, etc.) — these are passed through as-is and are sometimes less intuitive.
Irena/Nika processing: internal parameter names from the tools, which are meaningful to users familiar with the relevant tool.
Note
No master list of all keywords is maintained, as the number and nature of keywords varies widely. To find a specific keyword, browse a representative wave note or contact the developer for assistance. Keyword names are not guaranteed to be unique across all tools; if conflicts are found, contact the developer to have them resolved. Not all parameters are guaranteed to be saved; if a needed value is missing, contact the developer to have it added.
GUI organization
The Metadata Browser panel has four main areas:
Data Controls and Selection — left third of the panel, from top to bottom. Contains data type selectors and a vertical listbox listing all data in the current Igor experiment that match the current selection criteria. Select which datasets will be probed during extraction here.
Metadata Selection — middle vertical listbox (with controls above it). Displays the available metadata keywords for the currently selected wave.
List of metadata to process — rightmost listbox. Contains the keywords that will be extracted from all selected folders.
Processing controls — bottom-right area. Used to run the extraction, display a results table, plot selected results, or view results in an Igor folder.
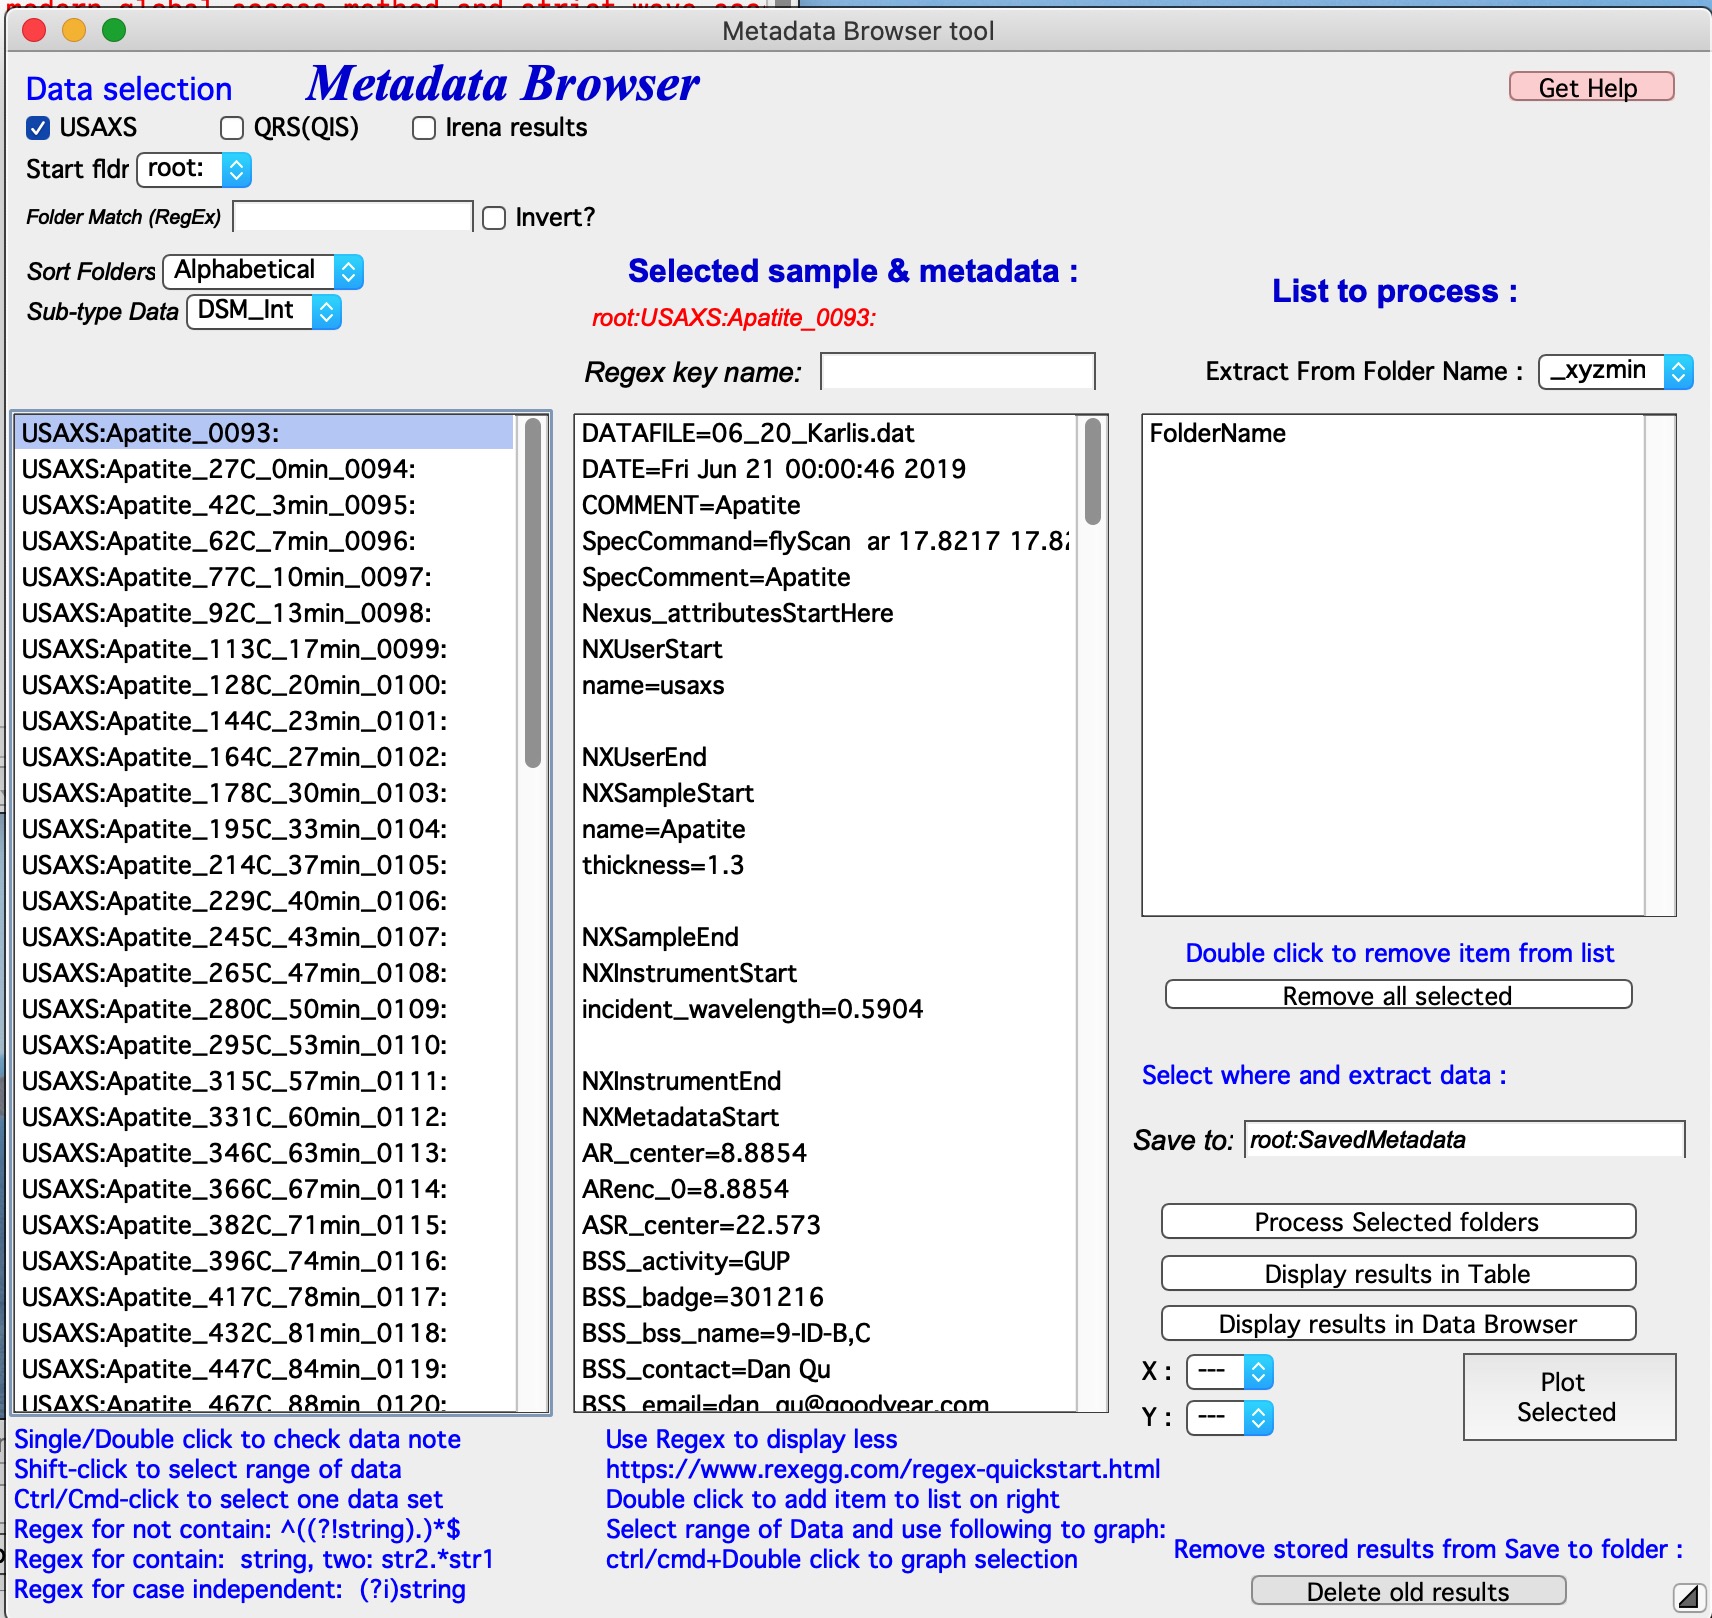
Data Controls and Selection
The top-left section is the data selector. Full details are in Multi Data selection.
Data types recognized:
USAXS — naming system for data from the APS USAXS instrument.
QRS — the default data naming system for SAXS/WAXS in Irena and Nika. See QRS data type.
Irena results — any fit or modeling output saved by Irena (size distributions, model fits, PDDF, diffraction peaks, etc.).
Any — when all checkboxes are unchecked, a regular expression can be entered to define which wave is X, Y, and optionally error. The first wave matching the expression is selected.
“Start Fldr” — Sets the starting location for the folder search
(e.g., root:SAXS:). A tighter starting folder makes the search faster.
“Folder Match (RegEx)” — Limits the displayed folders using a regular
expression. For example, entering 00034 shows only folders containing that
string in their name.
“Invert?” — Inverts the regular expression filter, showing folders that do NOT match.
“Sort Folders” — Sorts the folder list using one of several available methods. Correct ordering is important when processing sequential data (e.g., time or temperature series) so that result tables have a meaningful order.
Metadata selection
The middle column. The top shows (in red) the wave name currently selected in the left listbox. Clicking a dataset name in the left listbox updates this display and populates the middle listbox with all keyword=value pairs from the wave note.
Use “Regex Key name” to filter the displayed keywords by a regular expression, reducing the list when it is very long.
Double-click on a keyword=value entry to add that keyword to the right listbox, which defines the set of keywords to extract.
The folder name of the source data is always automatically included as a reference.
When the folder name contains useful encoded information (for example,
_246C encoding a temperature), the “Extract From Folder Name” pull-down
menu can parse and extract that value into a separate wave.
To remove a keyword from the extraction list, double-click it in the right listbox, or use the “Remove all” button below the listbox.
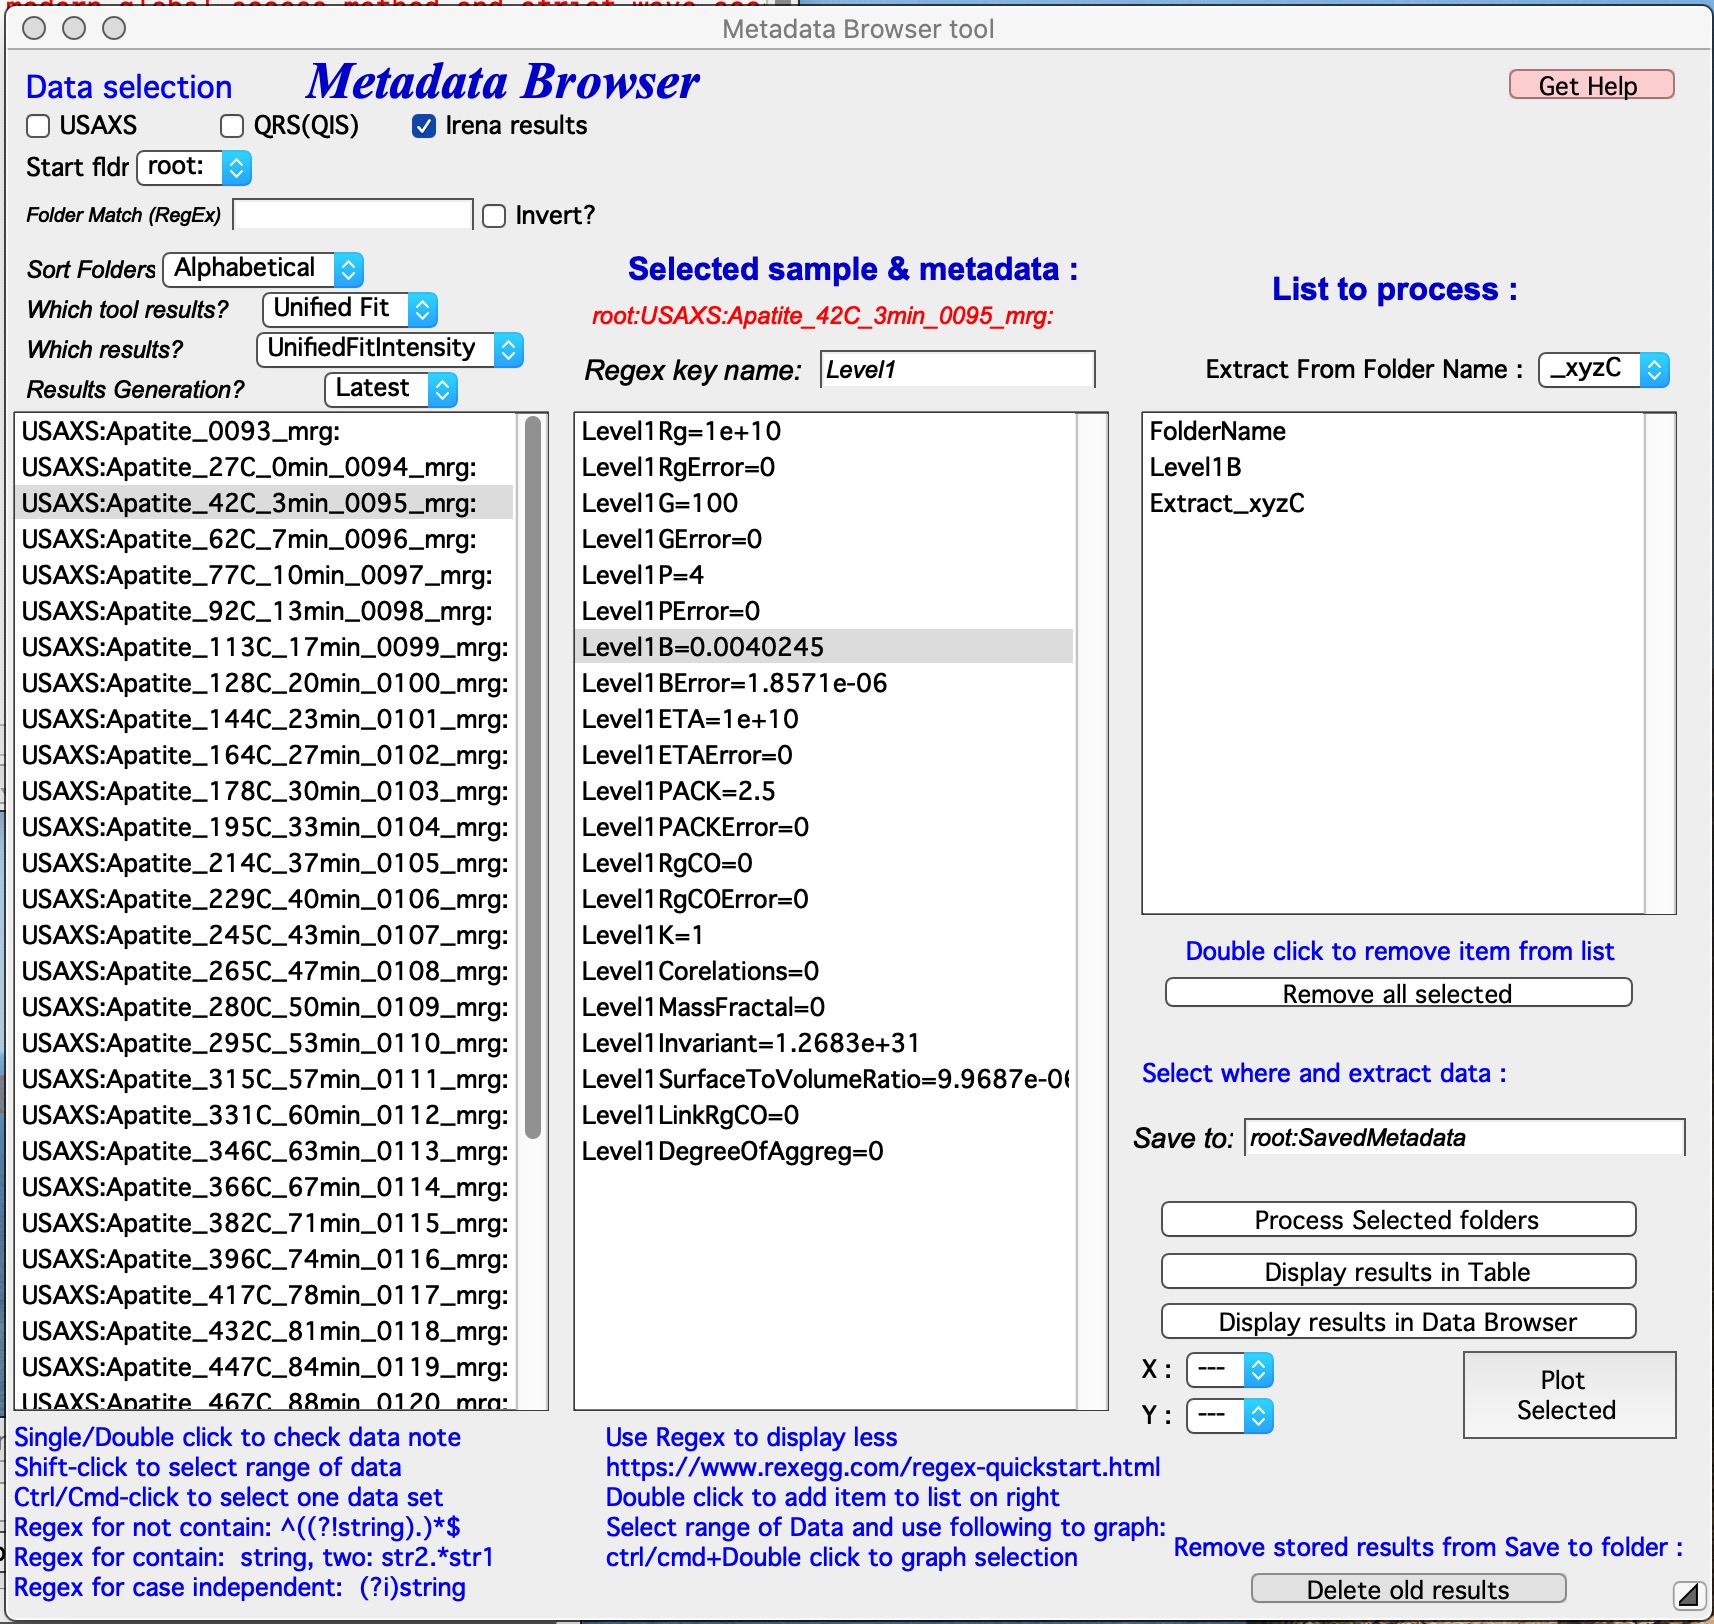
In the example above, the Unified Fit result wave UnifiedFitIntensity is
selected. The middle listbox is filtered to show only keywords containing
“Level1”. Double-clicking “Level1B” adds it to the extraction list. An
extraction of temperature from the folder name is also configured, since the
folder name encodes temperature in a recognizable format.
Metadata extraction and utilization
Select the datasets to process in the left listbox (Shift-click for a range, Ctrl/Cmd-click for individual items), then run the extraction.
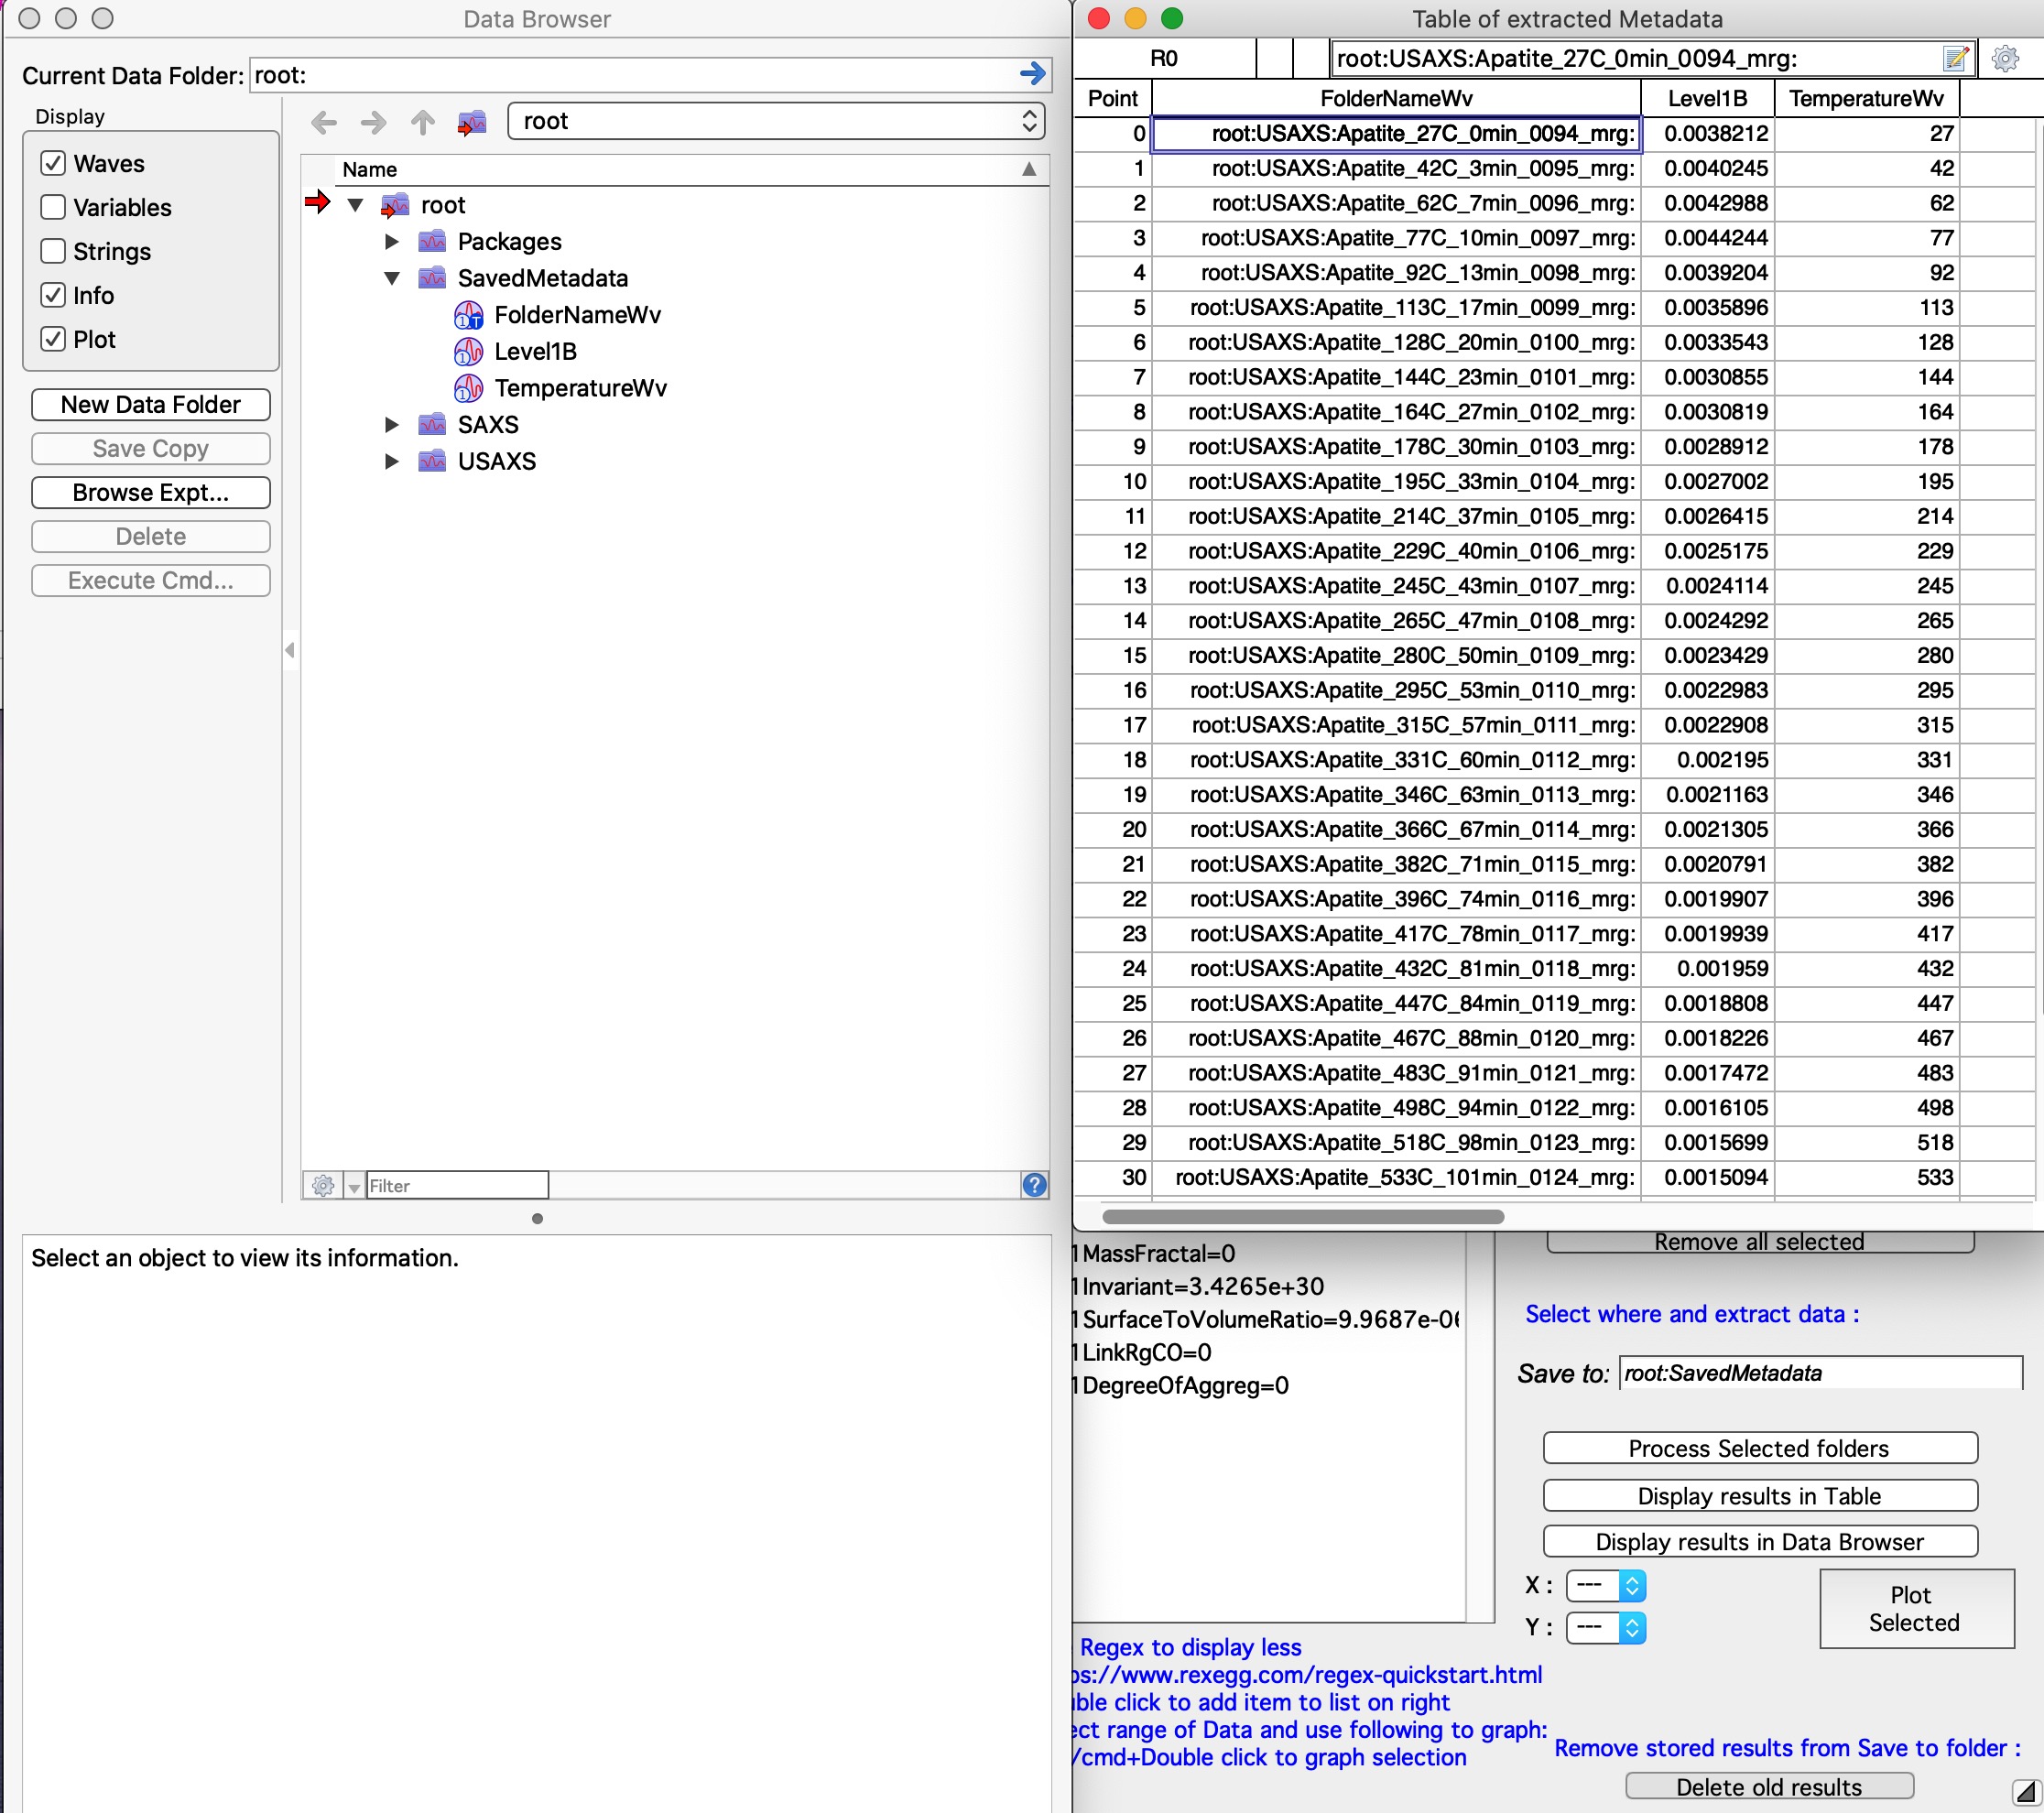
After extraction, the code creates a table of results. The output waves are
stored in the folder specified in the “Save to:” field on the panel. The
folder is created automatically; the name must be a valid Igor folder name
starting with root:.
In this example, the output folder contains three waves: FolderNameWv
(always created, text wave), Level1B (the extracted keyword value, numeric
wave), and TemperatureWv (extracted from the folder name by parsing
_xyzC as a temperature in °C). Numeric values produce numeric waves;
string values produce text waves; recognized date/time strings produce Igor
time waves.
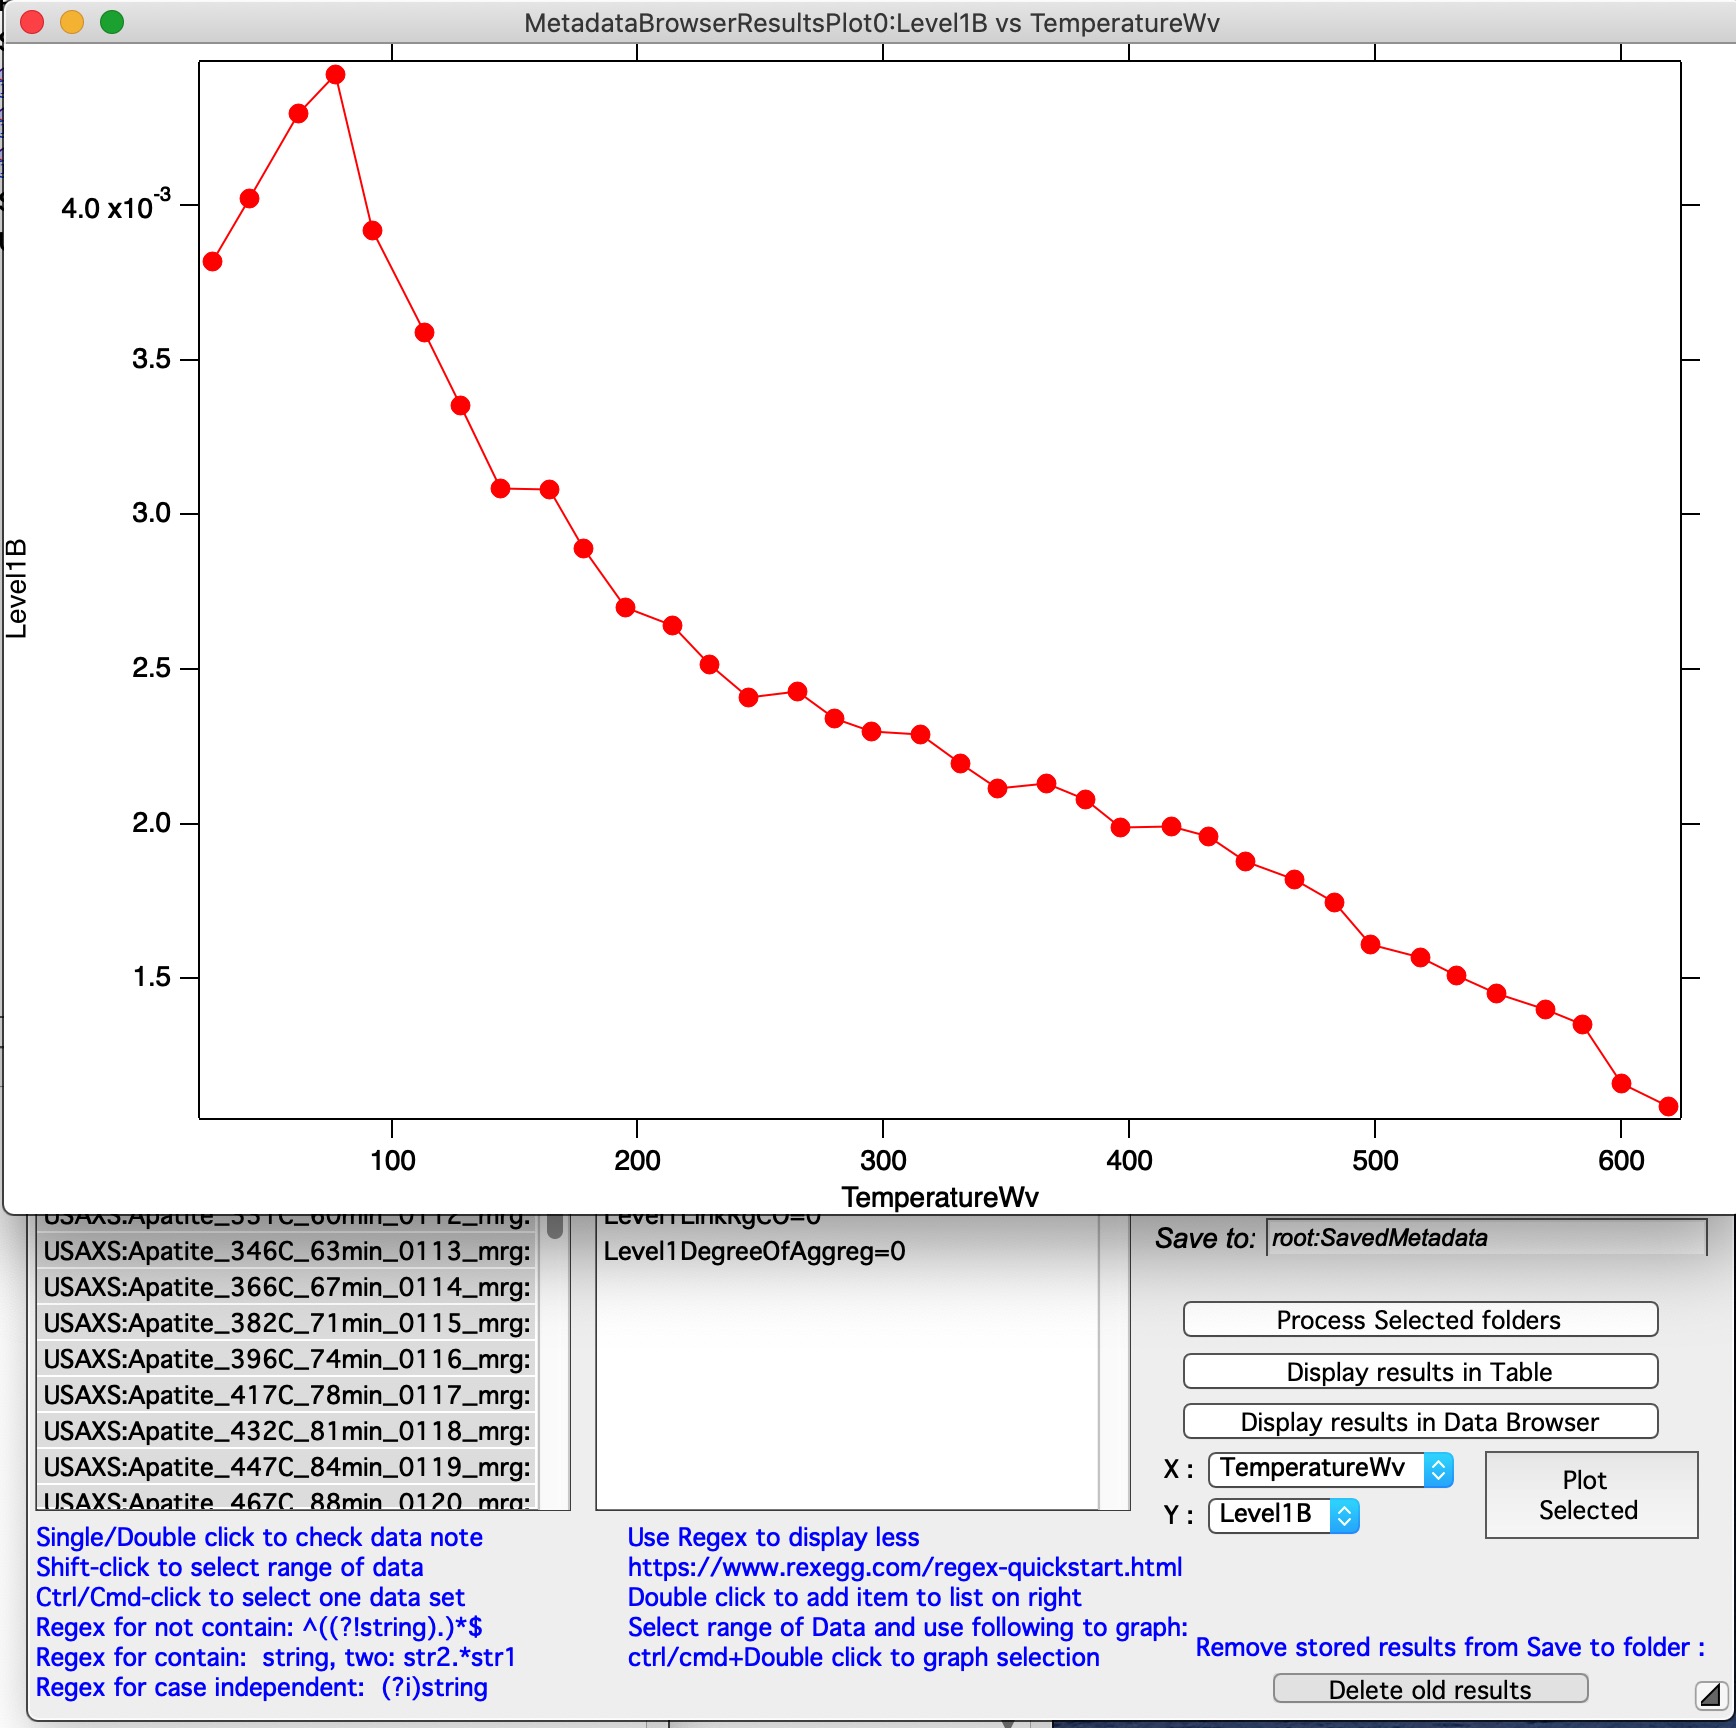
To generate a plot, use the “X:” and “Y:” popups to select axes and click “Plot Selected”. The example below shows Level1B (the Porod constant when P = 4) plotted against temperature:
“Delete old results” — Closes any graphs and tables using the results and deletes the folder specified in the “Save To:” field. The same result can be achieved manually through the Igor DataBrowser by closing associated windows and deleting the folder directly.